14% of global electricity is generated from Hydropower
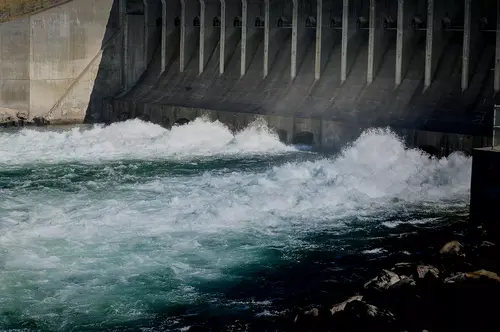
Hydroelectric energy, commonly referred to as hydro, is a clean and sustainable energy source generated by harnessing the power of flowing or falling water. As one of the oldest methods of electricity generation, it capitalizes on the kinetic energy of water bodies, such as rivers and waterfalls, converting this natural force into electrical energy through the use of turbines and generators. Due to its reliance on the natural water cycle and gravity, hydro provides a reliable and renewable form of energy that can produce electricity on demand, contributing significantly to global electricity consumption.
Hydroelectric power operates on a relatively simple principle: water stored in a reservoir behind a dam is released, causing it to flow through turbines. As the water flows, it spins the turbines, which are connected to generators that convert the mechanical energy into electrical energy. This process is highly efficient and can be adjusted based on electricity demand, allowing hydro plants to either increase or decrease output by controlling the water flow. Additionally, pumped-storage hydroelectricity allows for storage of energy, whereby water is pumped back up to the reservoir during periods of low electricity demand, serving as a form of energy storage to be used when demand is higher.
One of the most compelling advantages of hydroelectric power is its low carbon footprint. With an average carbon intensity of 24 gCO2eq/kWh, hydro is a leading low-carbon energy source, demonstrating significantly less carbon emissions compared to fossil fuels like coal, which has a carbon intensity of 820 gCO2eq/kWh, and gas at 490 gCO2eq/kWh. This stark difference highlights the critical role that hydro, along with other clean energy sources like nuclear (12 gCO2eq/kWh), solar (45 gCO2eq/kWh), and wind (11 gCO2eq/kWh), plays in reducing greenhouse gas emissions and combating climate change.
Globally, hydroelectricity accounts for approximately 14% of all electricity consumption. This highlights the substantial contribution of hydro to the worldwide energy mix and underscoring the importance of investing in and expanding such low-carbon technologies. The ability of hydroelectric power to provide significant portions of electricity in countries like Iceland, Norway, and Bhutan, where over 70% of their electricity comes from hydro, demonstrates its potential to transform energy systems towards more sustainable models. Similarly, regions in the United States such as Montana (39%) and Washington (68%) show how hydro can effectively supplement and diversify local electricity grids.
The reliance on hydroelectric power in various regions serves as a testament to its role in advancing a more sustainable energy infrastructure. Such examples can provide valuable insights and encourage other regions to explore and implement clean energy solutions, concentrating focus on increasing investments in nuclear and solar energy as well. Transitioning towards a low-carbon electrical grid is essential for future electrification needs, and integrating a mix of hydro, along with wind, nuclear, and solar, is key to achieving that vision. The urgency to foster such a transition is paramount in addressing the dual challenges of growing electricity demands and achieving significant emissions reductions.
| Country/Region | Per person | Share | Total Generation |
|---|---|---|---|
| Iceland | 33868.7 kWh | 73.4% | 13.6 TWh |
| Norway | 24059.8 kWh | 88.3% | 134.5 TWh |
| Bhutan | 14192.5 kWh | 93.1% | 11.2 TWh |
| Montana | 9790.3 kWh | 38.6% | 11.3 TWh |
| Washington | 9525.9 kWh | 67.8% | 76.1 TWh |
| Canada | 8808.6 kWh | 55.4% | 352.2 TWh |
| Greenland | 8397.5 kWh | 87.0% | 0.5 TWh |
| Oregon | 7609.2 kWh | 47.2% | 32.5 TWh |
| Paraguay | 6428.9 kWh | 99.5% | 44.0 TWh |
| Sweden | 6188.1 kWh | 40.1% | 66.1 TWh |
| South Dakota | 5920.9 kWh | 24.7% | 5.5 TWh |
| Idaho | 5476.8 kWh | 37.9% | 11.2 TWh |
| Laos | 5218.6 kWh | 76.5% | 40.0 TWh |
| New Zealand | 4860.4 kWh | 59.2% | 25.6 TWh |
| Switzerland | 4009.9 kWh | 52.9% | 36.1 TWh |
| Austria | 3321.9 kWh | 40.3% | 30.7 TWh |
| Albania | 3190.9 kWh | 82.2% | 8.8 TWh |
| North Dakota | 3175.4 kWh | 5.8% | 2.5 TWh |
| Montenegro | 2873.1 kWh | 52.3% | 1.8 TWh |
| Georgia | 2750.6 kWh | 69.2% | 10.5 TWh |
| Alaska | 2497.7 kWh | 27.5% | 1.8 TWh |
| Faroe Islands | 2407.9 kWh | 27.1% | 0.1 TWh |
| Venezuela | 2296.0 kWh | 78.3% | 65.0 TWh |
| Finland | 2249.2 kWh | 14.3% | 12.7 TWh |
| Wyoming | 2112.9 kWh | 2.8% | 1.2 TWh |
| Tajikistan | 2045.3 kWh | 93.0% | 22.1 TWh |
| French Guiana | 2011.5 kWh | 61.2% | 0.6 TWh |
| New Caledonia | 1880.9 kWh | 17.5% | 0.5 TWh |
| Costa Rica | 1864.4 kWh | 73.4% | 9.6 TWh |
| Brazil | 1834.4 kWh | 50.9% | 390.8 TWh |
| Uruguay | 1776.1 kWh | 45.1% | 6.0 TWh |
| Maine | 1770.0 kWh | 15.1% | 2.5 TWh |
| Vermont | 1756.8 kWh | 18.0% | 1.1 TWh |
| Portugal | 1723.1 kWh | 27.4% | 18.1 TWh |
| Bosnia & Herzegovina | 1694.2 kWh | 38.0% | 5.2 TWh |
| Alabama | 1597.1 kWh | 5.8% | 8.3 TWh |
| Slovenia | 1542.5 kWh | 23.7% | 3.3 TWh |
| Ecuador | 1528.1 kWh | 71.4% | 28.0 TWh |
| Croatia | 1465.2 kWh | 27.9% | 5.6 TWh |
| Suriname | 1431.2 kWh | 42.1% | 0.9 TWh |
| Latvia | 1396.4 kWh | 34.2% | 2.6 TWh |
| Panama | 1379.3 kWh | 47.8% | 6.2 TWh |
| Russia | 1368.3 kWh | 17.2% | 198.1 TWh |
| Serbia | 1343.5 kWh | 24.1% | 8.9 TWh |
| New York | 1265.5 kWh | 15.3% | 24.9 TWh |
| Luxembourg | 1248.9 kWh | 15.0% | 0.9 TWh |
| Colombia | 1224.1 kWh | 70.9% | 65.5 TWh |
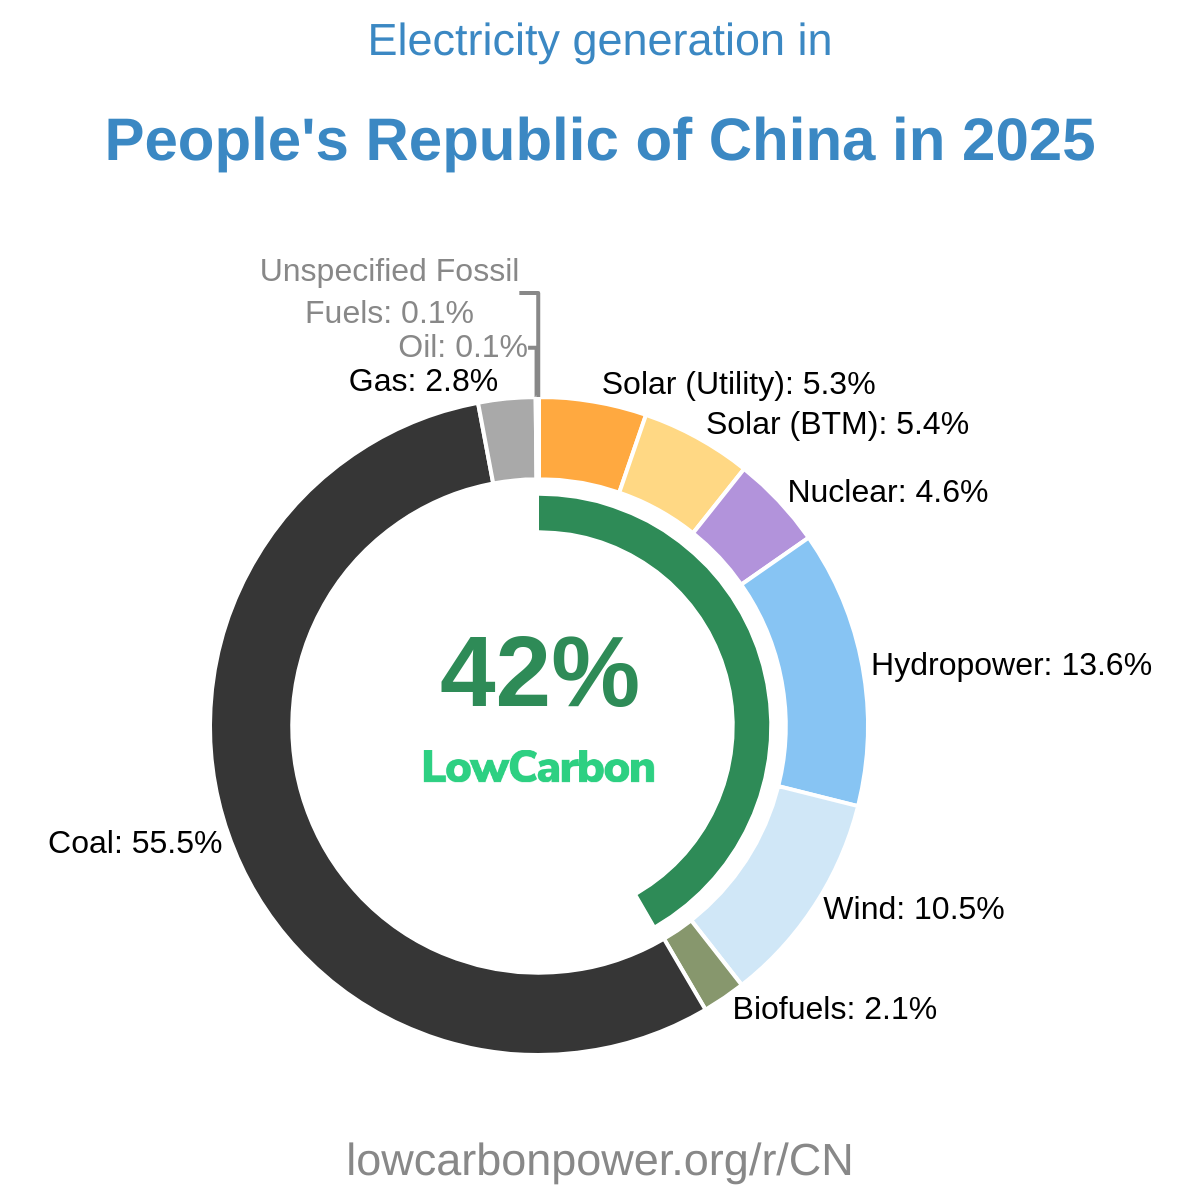
| People's Republic of China | 1063.6 kWh | 14.0% | 1514.2 TWh |
| Tennessee | 993.4 kWh | 6.1% | 7.3 TWh |
| Arkansas | 942.5 kWh | 4.3% | 2.9 TWh |
| Peru | 938.5 kWh | 52.1% | 32.4 TWh |
| Turkey | 935.3 kWh | 24.7% | 82.7 TWh |
| Chile | 934.4 kWh | 19.9% | 18.6 TWh |
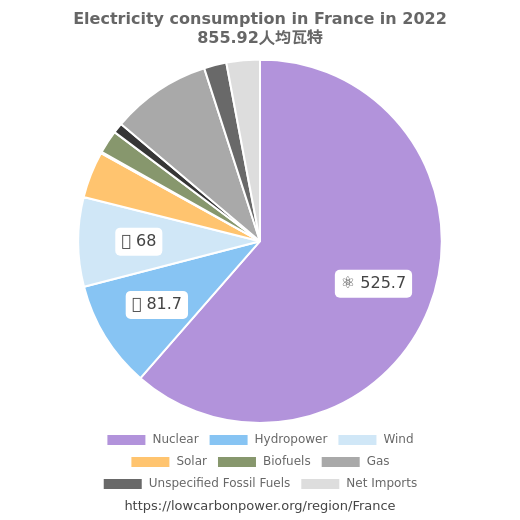
| France | 912.4 kWh | 10.8% | 61.0 TWh |
| Malaysia | 911.6 kWh | 17.0% | 32.8 TWh |
| New Hampshire | 885.7 kWh | 6.6% | 1.3 TWh |
| North Macedonia | 884.1 kWh | 18.7% | 1.6 TWh |
| Vietnam | 858.4 kWh | 33.7% | 87.6 TWh |
| Armenia | 858.0 kWh | 25.2% | 2.5 TWh |
| Kyrgyzstan | 855.4 kWh | 77.7% | 6.2 TWh |
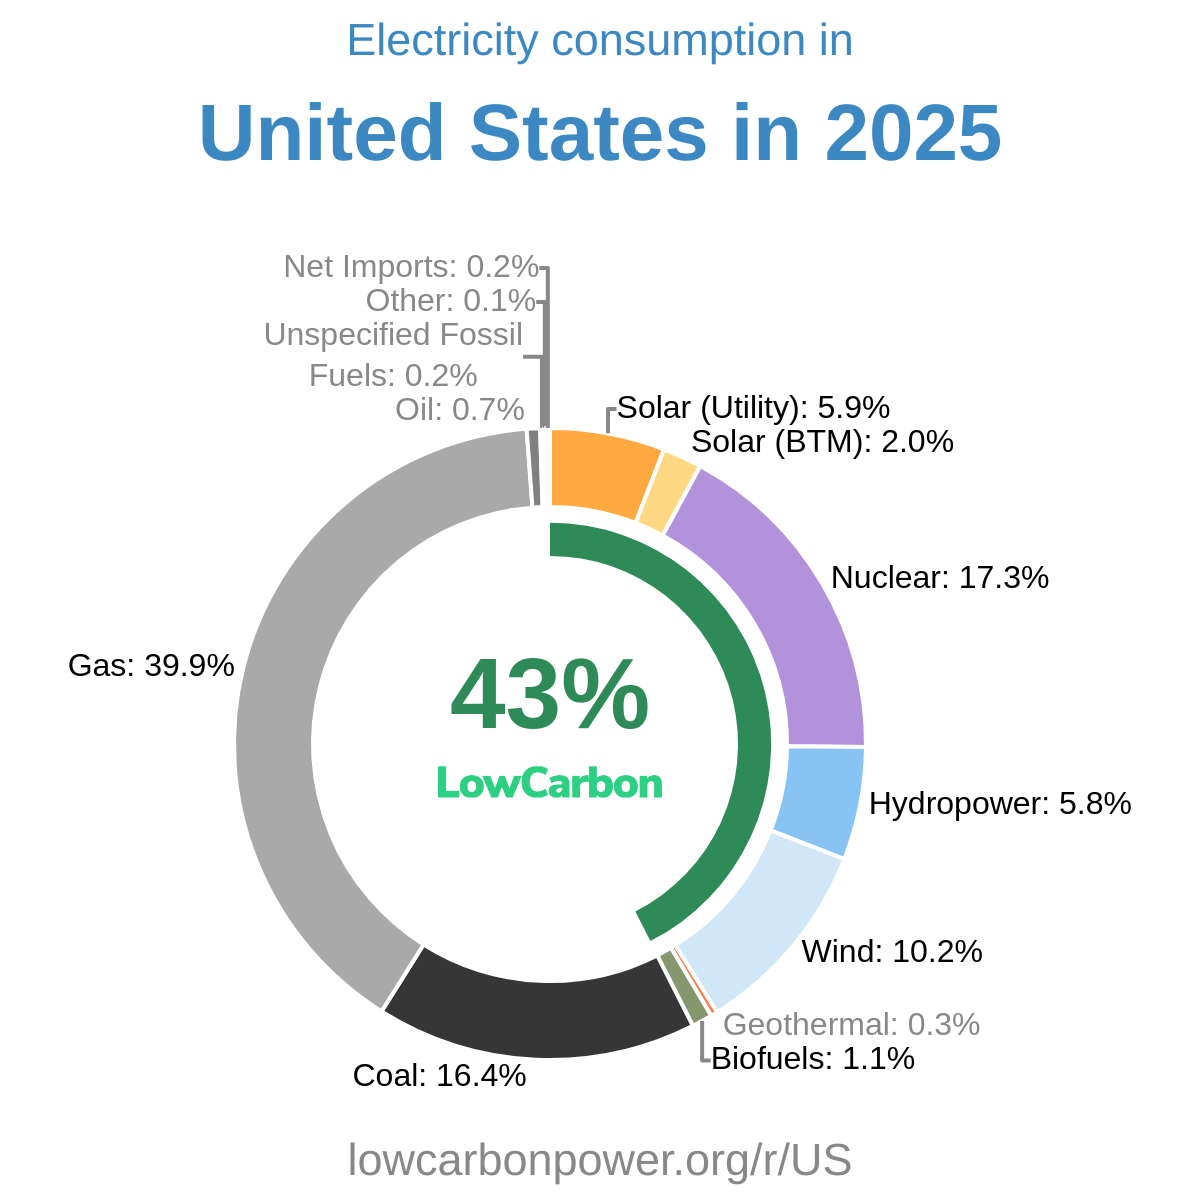
| United States | 838.9 kWh | 6.2% | 290.1 TWh |
| Zambia | 824.7 kWh | 87.8% | 17.1 TWh |
| Kentucky | 814.6 kWh | 4.5% | 3.7 TWh |
| Spain | 791.5 kWh | 13.1% | 38.1 TWh |
| EU | 733.5 kWh | 12.1% | 330.9 TWh |
| Nebraska | 728.0 kWh | 3.4% | 1.5 TWh |
| Réunion | 722.9 kWh | 18.7% | 0.6 TWh |
| Romania | 695.2 kWh | 26.4% | 13.1 TWh |
| West Virginia | 687.9 kWh | 2.2% | 1.2 TWh |
| Bulgaria | 678.9 kWh | 11.6% | 4.5 TWh |
| Arizona | 678.7 kWh | 4.2% | 5.2 TWh |
| French Polynesia | 677.8 kWh | 26.8% | 0.2 TWh |
| California | 672.7 kWh | 8.9% | 26.4 TWh |
| Greece | 657.6 kWh | 12.0% | 6.6 TWh |
| Fiji | 649.3 kWh | 52.2% | 0.6 TWh |
| North Korea | 630.5 kWh | 62.5% | 16.6 TWh |
| Japan | 621.4 kWh | 7.9% | 76.6 TWh |
| Argentina | 616.1 kWh | 19.3% | 28.2 TWh |
| Gabon | 611.7 kWh | 40.3% | 1.5 TWh |
| Slovakia | 609.8 kWh | 12.0% | 3.4 TWh |
| Italy | 605.8 kWh | 11.0% | 35.8 TWh |
| Belize | 583.8 kWh | 32.9% | 0.2 TWh |
| The World | 537.0 kWh | 14.2% | 4420.2 TWh |
| Kazakhstan | 490.0 kWh | 8.3% | 10.2 TWh |
| Australia | 487.5 kWh | 4.8% | 13.1 TWh |
| Mozambique | 480.7 kWh | 82.7% | 16.2 TWh |
| Namibia | 445.5 kWh | 28.4% | 1.3 TWh |
| Nevada | 427.5 kWh | 3.0% | 1.4 TWh |
| Wisconsin | 422.0 kWh | 3.2% | 2.5 TWh |
| Iowa | 414.2 kWh | 1.8% | 1.3 TWh |
| Oklahoma | 381.2 kWh | 1.7% | 1.6 TWh |
| North Carolina | 374.8 kWh | 2.7% | 4.2 TWh |
| Honduras | 364.5 kWh | 32.6% | 3.9 TWh |
| Angola | 361.1 kWh | 74.0% | 13.3 TWh |
| Nepal | 356.4 kWh | 94.6% | 10.6 TWh |
| Colorado | 349.0 kWh | 3.2% | 2.1 TWh |
| El Salvador | 341.8 kWh | 25.1% | 2.2 TWh |
| Sri Lanka | 341.7 kWh | 40.5% | 7.9 TWh |
| South Carolina | 340.0 kWh | 1.8% | 1.9 TWh |
| Zimbabwe | 334.1 kWh | 53.5% | 5.5 TWh |
| Republic of China (Taiwan) | 327.2 kWh | 2.6% | 7.6 TWh |
| Azerbaijan | 325.7 kWh | 12.9% | 3.4 TWh |
| Guatemala | 311.7 kWh | 40.6% | 5.7 TWh |
| Dominica | 300.9 kWh | 13.3% | 0.0 TWh |
| Cambodia | 299.9 kWh | 24.7% | 5.3 TWh |
| Lithuania | 297.7 kWh | 6.9% | 0.9 TWh |
| Ghana | 272.0 kWh | 37.8% | 9.2 TWh |
| Ukraine | 270.4 kWh | 9.8% | 11.1 TWh |
| Equatorial Guinea | 265.2 kWh | 31.2% | 0.5 TWh |
| Czechia | 250.2 kWh | 3.7% | 2.7 TWh |
| Bolivia | 248.6 kWh | 26.1% | 3.1 TWh |
| Eswatini | 243.8 kWh | 20.1% | 0.3 TWh |
| Utah | 238.9 kWh | 2.1% | 0.8 TWh |
| Mexico | 234.1 kWh | 8.3% | 30.8 TWh |
| Ireland | 230.7 kWh | 3.4% | 1.2 TWh |
| Sudan | 229.8 kWh | 65.2% | 11.5 TWh |
| Germany | 226.7 kWh | 4.1% | 19.2 TWh |
| Maryland | 222.8 kWh | 2.1% | 1.4 TWh |
| Lesotho | 210.0 kWh | 52.7% | 0.5 TWh |
| Guinea | 208.3 kWh | 74.1% | 3.0 TWh |
| St. Vincent & Grenadines | 197.5 kWh | 13.3% | 0.0 TWh |
| Cameroon | 185.4 kWh | 62.7% | 5.3 TWh |
| Uzbekistan | 185.1 kWh | 8.3% | 6.6 TWh |
| Missouri | 182.8 kWh | 1.3% | 1.1 TWh |
| Myanmar (Burma) | 174.8 kWh | 37.7% | 9.5 TWh |
| Louisiana | 174.6 kWh | 0.7% | 0.8 TWh |
| Congo - Brazzaville | 169.8 kWh | 20.3% | 1.1 TWh |
| Minnesota | 168.3 kWh | 1.3% | 1.0 TWh |
| Pakistan | 157.7 kWh | 23.9% | 40.4 TWh |
| Georgia (US) | 149.1 kWh | 1.0% | 1.7 TWh |
| South Korea | 140.0 kWh | 1.1% | 7.2 TWh |
| Egypt | 139.9 kWh | 6.7% | 16.5 TWh |
| Samoa | 138.5 kWh | 20.0% | 0.0 TWh |
| Ethiopia | 136.9 kWh | 96.5% | 17.6 TWh |
| Dominican Republic | 134.1 kWh | 6.5% | 1.6 TWh |
| Belarus | 133.1 kWh | 2.7% | 1.2 TWh |
| Congo - Kinshasa | 129.2 kWh | 79.0% | 13.7 TWh |
| Lebanon | 121.2 kWh | 15.5% | 0.7 TWh |
| Thailand | 120.8 kWh | 3.8% | 8.7 TWh |
| Sub-Saharan Africa | 119.7 kWh | 28.6% | 147.3 TWh |
| India | 117.0 kWh | 8.3% | 171.0 TWh |
| Pennsylvania | 115.7 kWh | 0.6% | 1.5 TWh |
| Belgium | 108.0 kWh | 1.6% | 1.3 TWh |
| Côte d’Ivoire | 107.5 kWh | 30.1% | 3.4 TWh |
| United Kingdom | 106.9 kWh | 2.4% | 7.4 TWh |
| Philippines | 106.5 kWh | 10.6% | 12.5 TWh |
| Uganda | 105.3 kWh | 86.6% | 5.0 TWh |
| Papua New Guinea | 96.3 kWh | 21.1% | 1.0 TWh |
| Nicaragua | 95.3 kWh | 11.8% | 0.7 TWh |
| Indonesia | 87.4 kWh | 7.0% | 24.6 TWh |
| Michigan | 83.5 kWh | 0.7% | 0.8 TWh |
| Malawi | 82.2 kWh | 92.3% | 1.7 TWh |
| Connecticut | 78.8 kWh | 0.6% | 0.3 TWh |
| Poland | 72.2 kWh | 1.7% | 2.8 TWh |
| Mauritius | 70.7 kWh | 2.8% | 0.1 TWh |
| Mali | 69.0 kWh | 35.8% | 1.6 TWh |
| Kenya | 61.5 kWh | 23.3% | 3.5 TWh |
| Nigeria | 50.9 kWh | 35.2% | 12.1 TWh |
| São Tomé & Príncipe | 44.2 kWh | 11.1% | 0.0 TWh |
| Indiana | 43.5 kWh | 0.3% | 0.3 TWh |
| Mauritania | 43.1 kWh | 10.4% | 0.2 TWh |
| Jamaica | 42.3 kWh | 2.7% | 0.1 TWh |
| Iran | 40.8 kWh | 3.5% | 3.8 TWh |
| Tanzania | 40.5 kWh | 24.2% | 2.7 TWh |
| Rwanda | 40.1 kWh | 51.9% | 0.6 TWh |
| South Africa | 37.2 kWh | 1.1% | 2.4 TWh |
| Massachusetts | 36.2 kWh | 0.4% | 0.3 TWh |
| Texas | 34.8 kWh | 0.2% | 1.1 TWh |
| Syria | 33.4 kWh | 3.7% | 0.8 TWh |
| Vanuatu | 31.2 kWh | 12.5% | 0.0 TWh |
| Ohio | 30.8 kWh | 0.2% | 0.4 TWh |
| Iraq | 30.6 kWh | 0.9% | 1.4 TWh |
| Morocco | 29.6 kWh | 2.5% | 1.1 TWh |
| Central African Republic | 27.5 kWh | 100.0% | 0.1 TWh |
| Madagascar | 26.9 kWh | 31.1% | 0.8 TWh |
| Guadeloupe | 26.0 kWh | 0.6% | 0.0 TWh |
| Liberia | 23.7 kWh | 33.3% | 0.1 TWh |
| Sierra Leone | 21.3 kWh | 85.7% | 0.2 TWh |
| Hungary | 20.4 kWh | 0.4% | 0.2 TWh |
| Burundi | 19.0 kWh | 53.1% | 0.3 TWh |
| Afghanistan | 18.1 kWh | 10.4% | 0.8 TWh |
| Estonia | 17.6 kWh | 0.3% | 0.0 TWh |
| Senegal | 17.1 kWh | 3.6% | 0.3 TWh |
| Hawaii | 16.7 kWh | 0.2% | 0.0 TWh |
| Haiti | 16.5 kWh | 18.8% | 0.2 TWh |
| Moldova | 15.8 kWh | 1.2% | 0.0 TWh |
| Cuba | 10.9 kWh | 0.8% | 0.1 TWh |
| Togo | 8.6 kWh | 4.0% | 0.1 TWh |
| Kansas | 8.6 kWh | 0.0% | 0.0 TWh |
| Bangladesh | 6.1 kWh | 1.0% | 1.1 TWh |
| Burkina Faso | 5.2 kWh | 3.6% | 0.1 TWh |
| Netherlands | 2.5 kWh | 0.0% | 0.0 TWh |
| Illinois | 2.4 kWh | 0.0% | 0.0 TWh |
| Florida | 2.2 kWh | 0.0% | 0.1 TWh |
| Jordan | 1.8 kWh | 0.1% | 0.0 TWh |
| Turkmenistan | 1.4 kWh | 0.0% | 0.0 TWh |
| Denmark | 1.2 kWh | 0.0% | 0.0 TWh |
| Rhode Island | 0.5 kWh | 0.0% | 0.0 TWh |
| Algeria | 0.4 kWh | 0.0% | 0.0 TWh |