In 2022, more than 70% of electricity consumed in French Guiana came from low-carbon sources, while fossil fuels supplied almost 30%. Hydropower dominated the mix, providing about 61% of electricity, with solar and biofuels each contributing around 5%. This gives French Guiana a strong clean-electricity foundation, although its remaining reliance on fossil fuels contributes to climate change and air pollution.
Is Electricity Growing in French Guiana?
The latest figures do not show electricity consumption per person reaching new heights. In 2022, consumption was about 3,300 kWh per person, roughly 380 kWh—or 10%—below the record set in 2012. Low-carbon electricity generation was about 2,350 kWh per person, approximately 260 kWh below its 2006 peak, also a decline of around 10%. These shortfalls are concerning as electrification and growing AI-related demand call for more clean electricity. However, comparisons with historical peaks alone cannot establish whether total electricity consumption is currently growing.
Suggestions
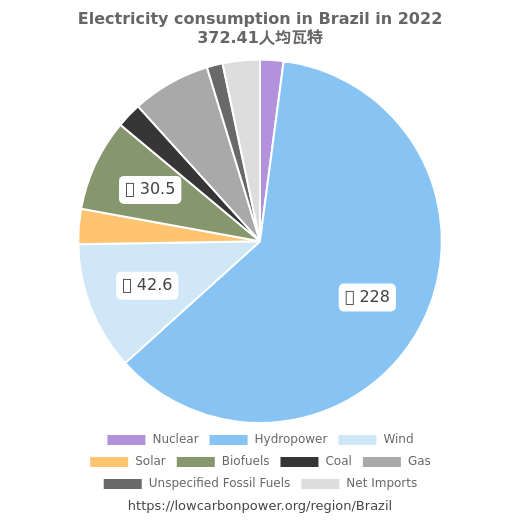
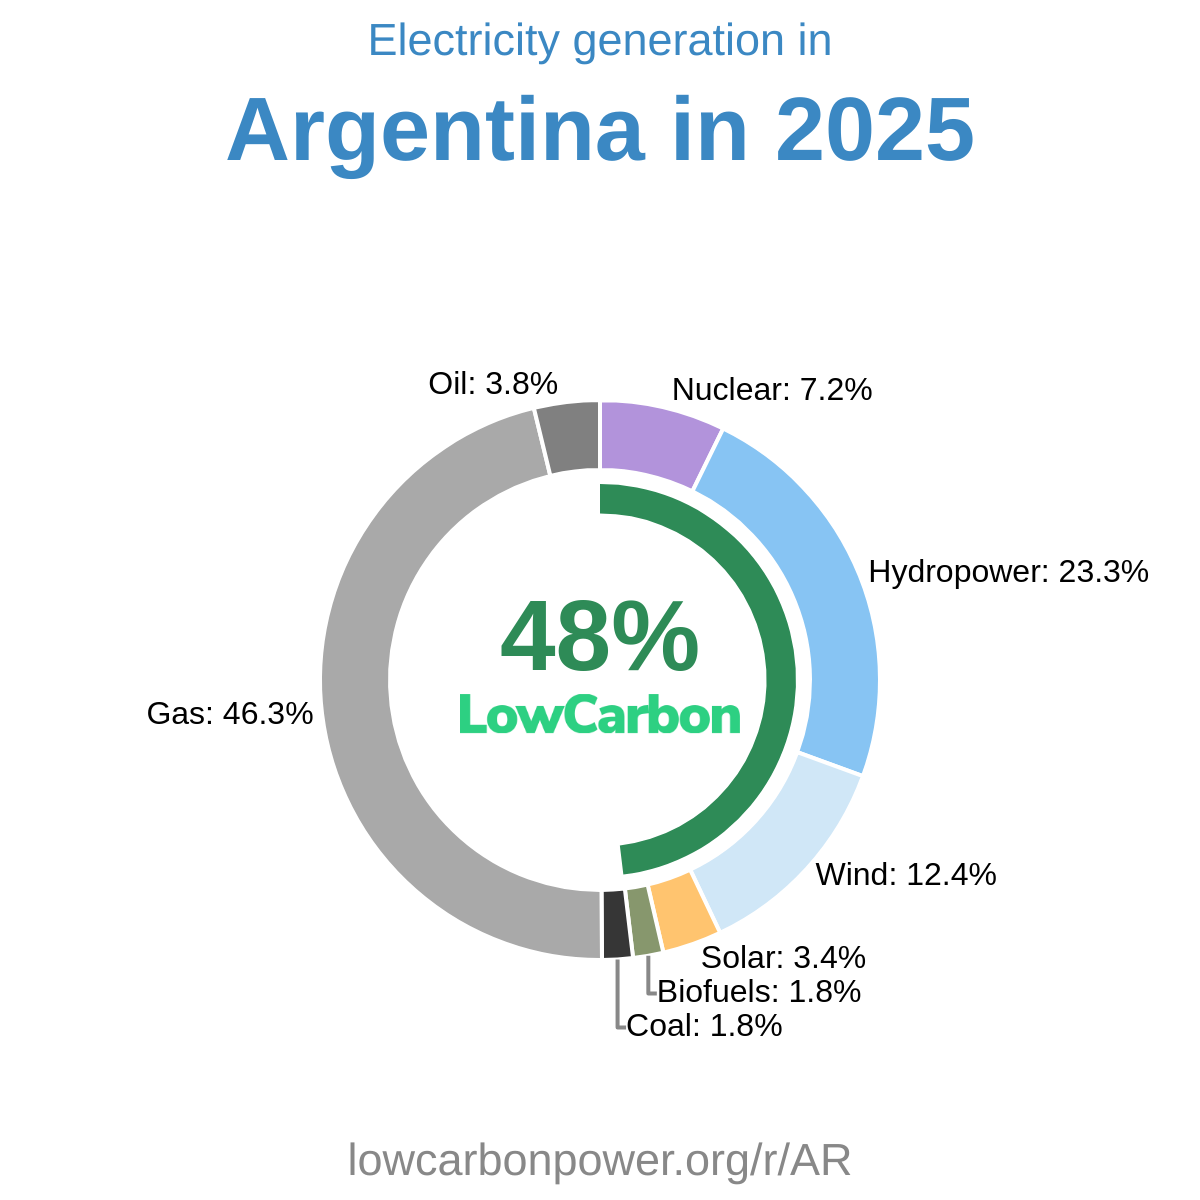
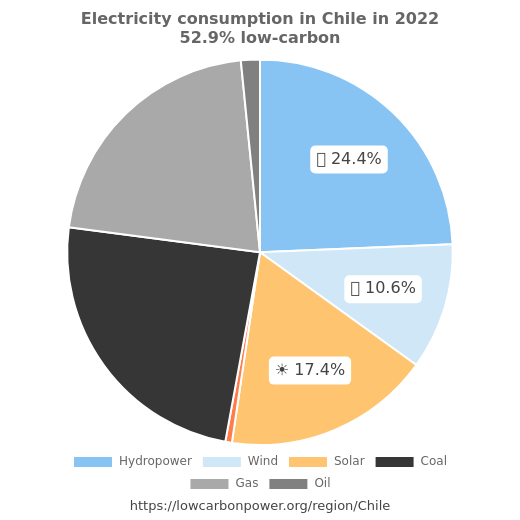
French Guiana should expand solar electricity alongside its existing hydropower and consider nuclear generation as part of its long-term clean-electricity planning. Relevant solar examples include the tropical US state of Hawaii, where solar supplies about 23% of electricity, and Chile, where it supplies 24%. France offers particularly relevant nuclear expertise: nuclear provides about two-thirds of its electricity. French Guiana could draw on that experience when assessing suitable nuclear options. Regional wind examples are also useful: Uruguay generates about a third of its electricity from wind, while neighboring Brazil generates 15%. Together, these regions demonstrate opportunities to diversify low-carbon generation and increase electricity supply.
History
The supplied history shows fluctuating hydropower generation rather than sustained expansion. During the 2000s, hydro fell by 0.1 TWh in 2003, recovered by the same amount in 2004, rose again in 2006, and declined in 2007. The largest listed fall was 0.2 TWh in 2009. In the early 2010s, gains of 0.1 TWh in both 2010 and 2012 were followed by a decline of that size in 2013; solar recorded no change in 2011. From 2016 through 2021, hydro continued alternating between declines, recoveries, and unchanged output, ending with a 0.1 TWh increase in 2021, while biofuels recorded no change that year. This uneven record underscores the need for sustained additions to clean electricity generation.
Electricity Imports and Exports
Balance of Trade
Nearby Regions