Over the past year, from June 2025 to May 2026, Germany has made significant strides in its low-carbon electricity generation. More than half of Germany's electricity, around 58%, has been derived from low-carbon sources, which is a promising direction towards sustainable energy consumption. Notably, wind power has emerged as the largest single source, producing almost a third of the total electricity with 30%. Solar power also contributed significantly, supplying close to a fifth of the electricity, while biofuels and hydropower together amounted to less than 10%. In comparison, fossil fuels still maintain a substantial share at over 39%, with coal and gas accounting for nearly 20% and 16%, respectively.
Is Electricity Growing in Germany?
Looking at the broader trend, Germany’s electricity consumption per person has noticeably decreased. The current consumption stands at 5,544 kWh per person, which is significantly less than the record high of 7,906 kWh per person in 2008. This decline reflects reduced consumption by over 2,300 kWh per person. Similarly, the low-carbon electricity generation has also seen a reduction from its peak in 2019, down by 611 kWh per person. This highlight suggests that while Germany has aggressively pursued clean energy, there may be areas where the adoption and integration of these sources could be accelerated or better supported to enhance overall electricity capacity.
Suggestions
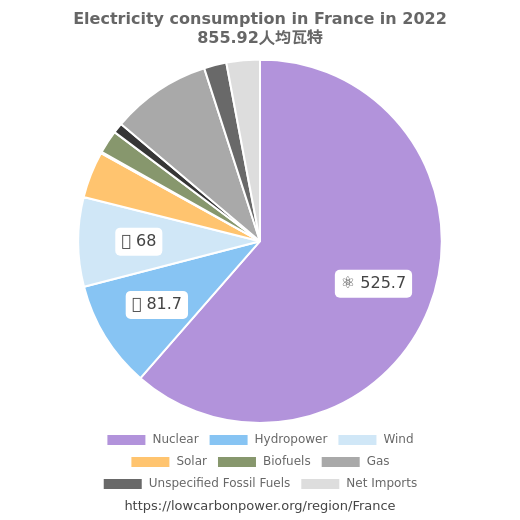
Germany can build on its strengths by continuing the expansion of wind and solar energy, which already show robust capacity and potential. Learning from international examples, Germany could consider bolstering its nuclear energy infrastructure as seen in France and Slovakia, where nuclear power contributes significantly to low-carbon electricity generation. Moreover, Denmark’s success with wind energy indicates that further investments and policies favoring wind power could greatly enhance Germany's clean energy portfolio. By integrating lessons from regions that have successfully harnessed nuclear, solar, and wind energy, Germany can achieve a more resilient, sustainable electricity grid.
* 12M = Last 12 months (Jun 2025 – May 2026) — a rolling 12-month period, not a calendar year.
History
A look at the historical trends in low-carbon electricity in Germany reveals a mixed trajectory, particularly concerning nuclear energy. In the early decades such as the 1980s and 1990s, Germany experienced growth in nuclear electricity generation. However, significant declines in nuclear power began in 2007, compounded further by drastic reductions post-2011. In contrast, wind energy saw positive growth spurts from 2011 onward, and solar energy gained momentum recently in 2025. It is crucial to reverse the declines in nuclear capacity and capitalize on the rising potential of wind and solar power to ensure Germany reaches higher levels of clean electricity generation in the near future.
* 12M = Last 12 months (Jun 2025 – May 2026) — a rolling 12-month period, not a calendar year.
Electricity Imports and Exports
Balance of Trade
* 12M = Last 12 months (Jun 2025 – May 2026) — a rolling 12-month period, not a calendar year.
Nearby Regions