

From September 2025 through August 2026, the Republic of China (Taiwan) relied on fossil fuels for about 86% of its electricity consumption, while low-carbon sources supplied only about 14%. Gas provided just over half of electricity, coal roughly a third, and oil around 1.5%. Within the clean electricity mix, solar contributed 6%, wind about 4.4%, hydropower about 2.6%, and other unspecified low-carbon sources about 1.4%. This leaves substantial room to expand clean electricity and reduce the climate impacts and air pollution associated with fossil fuels.
Is Electricity Growing in Republic of China (Taiwan)?
Electricity consumption per person is growing, although only modestly: the latest 2026 figure reached about 12,632 kWh, exceeding the previous record of 12,518 kWh in 2025 by 114 kWh, or roughly 1%. That new high is welcome as electrification and AI create additional electricity demand. However, low-carbon electricity generation per person remains disappointingly below its historic peak. At about 1,828 kWh, it is 550 kWh, or around 23%, below the 2013 record of 2,378 kWh. Overall electricity growth therefore needs a much stronger accompanying expansion of clean generation.
Suggestions
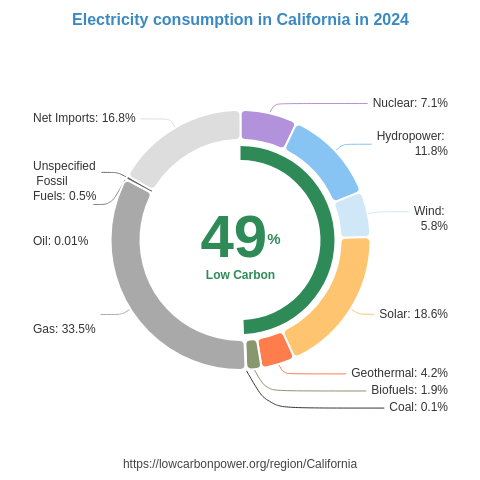
Taiwan should accelerate solar and wind development while pursuing a renewed nuclear contribution. South Korea offers a particularly relevant regional example of an advanced industrial economy, with nuclear supplying 25% of its electricity; France demonstrates an even larger contribution, at 67%. Taiwan can draw on these examples when considering nuclear investment and rebuilding its clean electricity supply. Rooftop and other suitable solar installations also offer substantial opportunities: solar supplies 31% of electricity in the US state of California and 23% in the island region of Cyprus. For wind, the island economies of Ireland and the United Kingdom provide useful reference points, generating about 34% and 30% of their electricity from wind respectively. Combining these technologies with stronger grids and storage would support growing electricity demand while reducing fossil-fuel dependence.
* 12M = Last 12 months (Sep 2025 – Aug 2026) — a rolling 12-month period, not a calendar year.
History
Taiwan’s low-carbon electricity history shows strong early nuclear growth followed by deeply disappointing losses. Across the listed years of the 1980s, annual nuclear generation increased by a combined 25 TWh; in 1990, nuclear added another 4.9 TWh and hydropower 3.3 TWh. A 3 TWh nuclear decline in 2001 was followed by a 4.1 TWh rebound in 2002. Much larger setbacks arrived in 2015–2017, when the listed annual nuclear reductions totalled nearly 20 TWh, only partly offset by gains of almost 10 TWh in 2018–2019. Nuclear generation then fell every year from 2021 through 2025, with those reductions totalling about 28 TWh, including an especially severe 8.9 TWh loss in 2025. Wind’s 4.3 TWh gain in 2024 was welcome, but did not even offset that year’s 5.6 TWh nuclear decline. Losing so much low-carbon nuclear output is a serious setback that undermines clean electricity progress; Taiwan should prioritize reversing this trajectory alongside rapid solar and wind expansion.
* 12M = Last 12 months (Sep 2025 – Aug 2026) — a rolling 12-month period, not a calendar year.
Electricity Imports and Exports
Balance of Trade
* 12M = Last 12 months (Sep 2025 – Aug 2026) — a rolling 12-month period, not a calendar year.
Nearby Regions