Over the last year, from April 2025 to March 2026, electricity consumption in Russia has been predominantly fueled by fossil energy, which accounts for over two-thirds of total electricity generation. The majority of this fossil energy is derived from gas, making up nearly 44% of the total, while coal provides about 18%. Low-carbon energy sources contribute to almost 37% of Russia's electricity, with nuclear energy being the largest contributor at roughly 19%. Hydropower also plays a significant role, supplying close to 17% of electricity. This reliance on both fossil and low-carbon energy sources shows a diverse energy mix, yet there is significant room for growth in clean energy options to reduce the environmental impact.
Is Electricity Growing in Russia?
The current situation regarding electricity consumption in Russia seems to be slightly declining, raising concerns about future growth, especially in the domain of low-carbon energy generation. In 2026, the electricity consumption per person stood at 7984 kWh, which saw a decrease of about 57 kWh per person from the record set in 2024. Likewise, the low-carbon electricity generation per person fell by 104 kWh, from a high of 3035 kWh in 2021. These decreases, particularly in the low-carbon sector, are troubling given the urgent need to expand clean energy to address climate change and air pollution challenges efficiently.
Suggestions
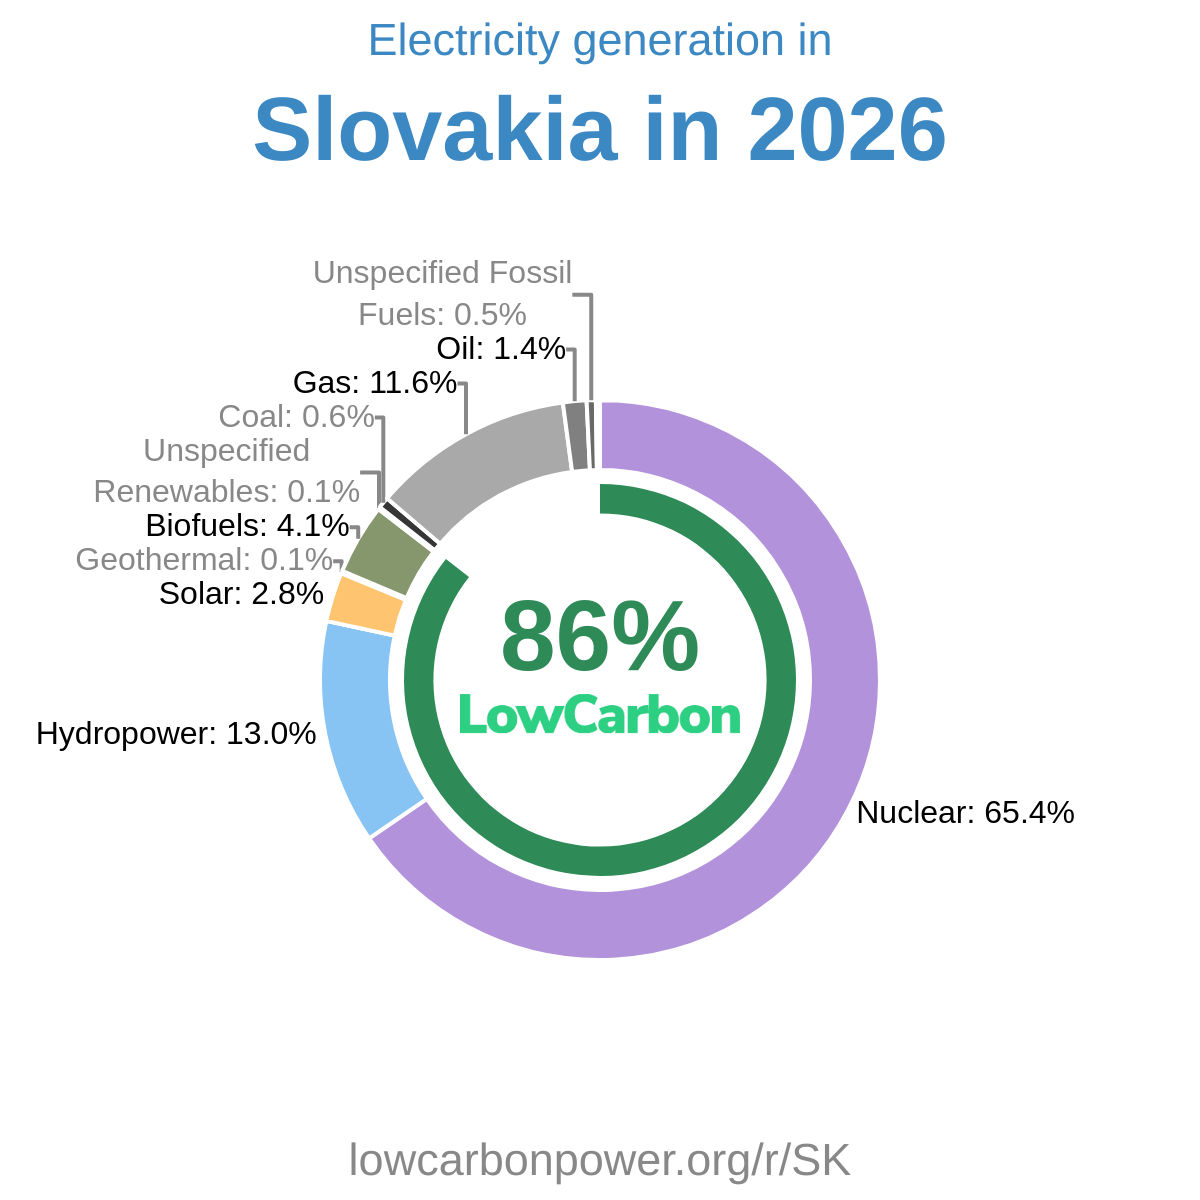
Russia's potential to increase low-carbon electricity generation can significantly benefit from the expansion of its substantial nuclear capabilities. Learning from countries like France, where 67% of electricity comes from nuclear power, and Slovakia, with 65%, can offer valuable insights for enhancing nuclear infrastructure. Furthermore, observing regions such as Denmark and Iowa with strong performances in wind energy generation, at 60% and 57% respectively, provides clear pathways to broaden the integration of wind energy into Russia's energy mix. Additionally, exploring the solar sector's achievements in areas like Nevada and California, where solar contributes about 31% of electricity, suggests that Russia could significantly expand its solar footprint, offsetting its fossil fuel dependency and propelling forward its low-carbon ambitions.
* 12M = Last 12 months (Apr 2025 – Mar 2026) — a rolling 12-month period, not a calendar year.
History
Historically, Russia's low-carbon electricity, particularly from nuclear and hydro sources, has experienced dynamic shifts. During the late 1980s, nuclear energy grew quite considerably, but there were some setbacks in the early 1990s. However, the late 1990s and early 2000s saw a resurgence in nuclear capacity expansion. The hydro sector, on the other hand, experienced fluctuating periods of growth and contraction. For instance, the early 2000s marked periods of decline in hydroelectric output, followed by periods of recovery in subsequent years. Despite these ups and downs, the overall trend suggests an inherent capacity for growth, which Russia can further leverage by focusing on consistent expansion and modernization of clean energy infrastructure. This will support sustainable development and secure the future energy needs of the country.
* 12M = Last 12 months (Apr 2025 – Mar 2026) — a rolling 12-month period, not a calendar year.
Electricity Imports and Exports
Balance of Trade
* 12M = Last 12 months (Apr 2025 – Mar 2026) — a rolling 12-month period, not a calendar year.
Nearby Regions