

2% of global electricity is generated from Biofuels in 2025/2026
- People's Republic of China 229 TWh
- Brazil 54.9 TWh
- Japan 49.4 TWh
- United States 47.7 TWh
- United Kingdom 39.0 TWh
- Finland 1,793 kWh
- Denmark 1,180 kWh
- Sweden 1,021 kWh
- Estonia 747 kWh
- United Kingdom 562 kWh
From July 2025 through June 2026, biofuels generated 608 TWh of electricity worldwide, equivalent to about 2% of global electricity consumption. That is up from 460 TWh in 2016—an increase of 148 TWh, or roughly one-third, over a decade. Its global share changed much less, edging up from 1.8% to 1.95%, around 0.1 percentage points on the dataset’s rounded basis. Biofuels therefore contributed more low-carbon electricity, but its growth largely kept pace with the expanding global electricity system rather than substantially changing its role.
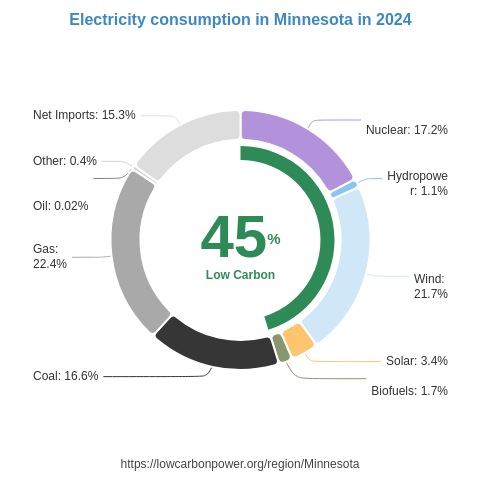
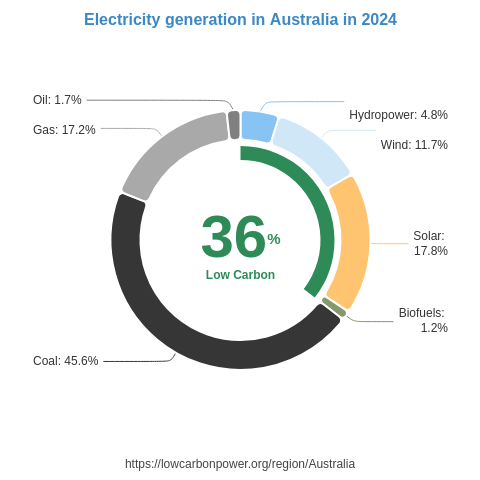
The People's Republic of China stands out for both scale and five-year growth: its 229 TWh accounts for nearly two-fifths of global biofuels generation, following an increase of about 75 TWh. Japan added around 19 TWh, while Indonesia added nearly 10 TWh; these are absolute increases, not percentage growth rankings. Brazil remains the second-largest producer at about 55 TWh, yet the greatest national reliance appears in smaller electricity systems: Guatemala gets almost a quarter of its electricity from biofuels, and Denmark about one-fifth. Finland leads generation per person at nearly 1,800 kWh, ahead of Denmark and Sweden, both above 1,000 kWh. Among US states, California and Georgia (US) each generate about 4.4 TWh, slightly ahead of Virginia at 3.7 TWh, although Virginia has the highest output per person of these three.
The IPCC lifecycle figure for biofuels is 230 gCO2eq/kWh, compared with 820 gCO2eq/kWh for coal, 490 gCO2eq/kWh for gas and 650 gCO2eq/kWh for oil. On those figures, biofuels electricity has roughly 72% lower lifecycle emissions than coal, 53% lower than gas and 65% lower than oil, offering a clear climate advantage when it replaces fossil-fuel generation. Wind, nuclear and solar likewise provide low-carbon electricity with lifecycle emissions well below those of fossil fuels. Together, these clean electricity sources can support electrification and growing demand while reducing dependence on fuels that drive climate change and air pollution; expanding nuclear and solar alongside other low-carbon generation can strengthen that progress.
| # | Country/Region | Total Generation ▼ | Share | Per person |
|---|---|---|---|---|
| 1 | People's Republic of China | 229 TWh | 2.1% | 160.7 kWh |
| 2 | Brazil | 54.9 TWh | 7.2% | 257.9 kWh |
| 3 | Japan | 49.4 TWh | 5.1% | 401.1 kWh |
| 4 | United States | 47.7 TWh | 1.0% | 137.8 kWh |
| 5 | United Kingdom | 39.0 TWh | 12.4% | 561.6 kWh |
| 6 | India | 36.3 TWh | 1.8% | 24.8 kWh |
| 7 | Indonesia | 22.5 TWh | 6.4% | 79.9 kWh |
| 8 | Germany | 20.2 TWh | 4.3% | 238.5 kWh |
| 9 | Italy | 15.5 TWh | 4.8% | 262.7 kWh |
| 10 | Sweden | 10.9 TWh | 6.6% | 1020.6 kWh |
| 11 | Canada | 10.4 TWh | 1.6% | 258.9 kWh |
| 12 | Finland | 10.1 TWh | 11.4% | 1792.8 kWh |
| 13 | Thailand | 9.40 TWh | 4.1% | 130.8 kWh |
| 14 | South Korea | 9.37 TWh | 1.5% | 181.1 kWh |
| 15 | France | 8.53 TWh | 1.5% | 127.7 kWh |
| 16 | Turkey | 7.78 TWh | 2.3% | 88.0 kWh |
| 17 | Denmark | 7.09 TWh | 19.5% | 1180.1 kWh |
| 18 | Poland | 6.84 TWh | 4.0% | 176.1 kWh |
| 19 | Netherlands | 6.63 TWh | 4.9% | 361.6 kWh |
| 20 | Chile | 5.82 TWh | 6.2% | 292.4 kWh |
| 21 | Spain | 5.45 TWh | 1.9% | 113.1 kWh |
| 22 | Malaysia | 5.19 TWh | 2.7% | 144.3 kWh |
| 23 | Czechia | 4.80 TWh | 6.5% | 441.0 kWh |
| 24 | Austria | 3.91 TWh | 5.1% | 422.5 kWh |
| 25 | Guatemala | 3.46 TWh | 24.8% | 190.9 kWh |
| 26 | Portugal | 3.14 TWh | 4.8% | 300.0 kWh |
| 27 | Belgium | 2.85 TWh | 3.6% | 241.2 kWh |
| 28 | Australia | 2.75 TWh | 1.0% | 102.1 kWh |
| 29 | Argentina | 2.63 TWh | 1.8% | 57.5 kWh |
| 30 | Switzerland | 2.19 TWh | 3.2% | 242.9 kWh |
| 31 | Hungary | 1.93 TWh | 4.0% | 200.3 kWh |
| 32 | Uruguay | 1.89 TWh | 14.2% | 558.5 kWh |
| 33 | Honduras | 1.25 TWh | 10.5% | 117.4 kWh |
| 34 | Bulgaria | 1.23 TWh | 3.1% | 183.7 kWh |
| 35 | Colombia | 1.18 TWh | 1.3% | 22.0 kWh |
| 36 | Mexico | 1.16 TWh | 0.3% | 8.8 kWh |
| 37 | Philippines | 1.15 TWh | 1.0% | 9.8 kWh |
| 38 | Slovakia | 1.12 TWh | 4.0% | 201.9 kWh |
| 39 | Estonia | 1.03 TWh | 12.1% | 746.9 kWh |
| 40 | Ireland | 0.9 TWh | 2.5% | 171.5 kWh |
| 41 | Croatia | 0.9 TWh | 4.5% | 236.2 kWh |
| 42 | Nicaragua | 0.9 TWh | 16.2% | 130.4 kWh |
| 43 | Lithuania | 0.8 TWh | 6.6% | 284.7 kWh |
| 44 | Ukraine | 0.8 TWh | 0.7% | 19.0 kWh |
| 45 | Russia | 0.8 TWh | 0.1% | 5.2 kWh |
| 46 | Pakistan | 0.7 TWh | 0.4% | 2.7 kWh |
| 47 | Peru | 0.5 TWh | 0.9% | 15.6 kWh |
| 48 | El Salvador | 0.5 TWh | 6.2% | 85.1 kWh |
| 49 | Greece | 0.5 TWh | 0.9% | 48.7 kWh |
| 50 | Uganda | 0.5 TWh | 8.2% | 9.9 kWh |
| 51 | Ecuador | 0.4 TWh | 1.1% | 23.5 kWh |
| 52 | Serbia | 0.4 TWh | 1.1% | 63.8 kWh |
| 53 | Latvia | 0.4 TWh | 5.0% | 203.5 kWh |
| 54 | Kenya | 0.3 TWh | 2.2% | 5.9 kWh |
| 55 | Cuba | 0.3 TWh | 2.2% | 29.9 kWh |
| 56 | Mauritius | 0.3 TWh | 9.8% | 251.3 kWh |
| 57 | Belarus | 0.3 TWh | 0.7% | 33.6 kWh |
| 58 | Romania | 0.3 TWh | 0.6% | 15.8 kWh |
| 59 | Republic of China (Taiwan) | 0.3 TWh | 0.1% | 12.5 kWh |
| 60 | Myanmar (Burma) | 0.3 TWh | 1.1% | 5.0 kWh |
| 61 | New Zealand | 0.2 TWh | 0.6% | 46.1 kWh |
| 62 | Paraguay | 0.2 TWh | 0.5% | 35.1 kWh |
| 63 | Slovenia | 0.2 TWh | 1.7% | 110.7 kWh |
| 64 | Dominican Republic | 0.2 TWh | 0.9% | 18.2 kWh |
| 65 | Eswatini | 0.2 TWh | 14.1% | 170.7 kWh |
| 66 | Norway | 0.2 TWh | 0.1% | 33.8 kWh |
| 67 | Hong Kong SAR China | 0.2 TWh | 0.3% | 21.5 kWh |
| 68 | Qatar | 0.1 TWh | 0.2% | 44.2 kWh |
| 69 | Mozambique | 0.1 TWh | 0.7% | 3.9 kWh |
| 70 | Zimbabwe | 0.1 TWh | 1.2% | 7.3 kWh |
| 71 | Bolivia | 0.1 TWh | 1.0% | 9.6 kWh |
| 72 | Egypt | 0.1 TWh | 0.0% | 1.0 kWh |
| 73 | Israel | 0.1 TWh | 0.1% | 11.9 kWh |
| 74 | Sudan | 0.1 TWh | 0.6% | 2.2 kWh |
| 75 | Senegal | 0.1 TWh | 1.3% | 6.1 kWh |
| 76 | Côte d’Ivoire | 0.1 TWh | 0.8% | 2.9 kWh |
| 77 | Burkina Faso | 0.1 TWh | 2.7% | 3.9 kWh |
| 78 | Zambia | 0.1 TWh | 0.4% | 3.9 kWh |
| 79 | Mali | 0.1 TWh | 1.5% | 2.9 kWh |
| 80 | Tanzania | 0.1 TWh | 0.6% | 1.1 kWh |
| 81 | Jamaica | 0.1 TWh | 1.3% | 21.1 kWh |
| 82 | Costa Rica | 0.1 TWh | 0.4% | 9.7 kWh |
| 83 | Angola | 0.1 TWh | 0.3% | 1.4 kWh |
| 84 | Malawi | 0.1 TWh | 2.7% | 2.4 kWh |
| 85 | North Macedonia | 0.0 TWh | 0.5% | 24.0 kWh |
| 86 | Laos | 0.0 TWh | 0.1% | 5.2 kWh |
| 87 | Panama | 0.0 TWh | 0.3% | 9.0 kWh |
| 88 | Cameroon | 0.0 TWh | 0.5% | 1.4 kWh |
| 89 | Cyprus | 0.0 TWh | 0.7% | 28.3 kWh |
| 90 | United Arab Emirates | 0.0 TWh | 0.0% | 2.8 kWh |
| 91 | Lebanon | 0.0 TWh | 0.7% | 5.2 kWh |
| 92 | Cambodia | 0.0 TWh | 0.1% | 1.7 kWh |
| 93 | Congo - Kinshasa | 0.0 TWh | 0.2% | 0.3 kWh |
| 94 | Syria | 0.0 TWh | 0.1% | 1.3 kWh |
| 95 | Madagascar | 0.0 TWh | 1.1% | 1.0 kWh |
| 96 | Moldova | 0.0 TWh | 0.5% | 7.0 kWh |
| 97 | Ghana | 0.0 TWh | 0.1% | 0.6 kWh |
| 98 | Gabon | 0.0 TWh | 0.3% | 4.0 kWh |
| 99 | Congo - Brazzaville | 0.0 TWh | 0.2% | 1.6 kWh |
| 100 | Ethiopia | 0.0 TWh | 0.1% | 0.1 kWh |
| 101 | Papua New Guinea | 0.0 TWh | 0.2% | 1.0 kWh |
| 102 | Burundi | 0.0 TWh | 2.0% | 0.7 kWh |
| 103 | Chad | 0.0 TWh | 2.6% | 0.5 kWh |