

From July 2025 through June 2026, low-carbon sources supplied more than half of Idaho’s electricity consumption—about 58%. Hydropower was the largest source at roughly 38%, followed by wind at 11%, solar at 7%, and biofuels at nearly 2%. Solar included about 6% from utility-scale installations and 1% from behind-the-meter systems, such as rooftop panels. Fossil electricity, entirely from gas in these figures, accounted for about 19%. Net imports supplied the remaining 23%; their low-carbon or fossil composition is not specified.
Is Electricity Growing in Idaho?
Idaho’s electricity consumption per person is not currently growing: the latest 2026 figure was about 14,440 kWh per person, down 60 kWh, or roughly 0.4%, from the 2025 record. Low-carbon electricity generation, however, reached a new high of about 8,330 kWh per person—an increase of 830 kWh, or around 11%, over its previous record in 2025. That clean electricity growth is encouraging, although the slight decline in consumption per person deserves attention as electrification and AI create additional electricity demand. These per-person figures alone do not establish whether Idaho’s total electricity consumption increased or decreased.
Suggestions
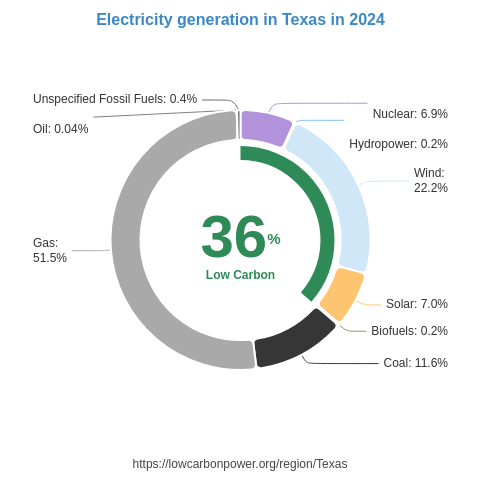
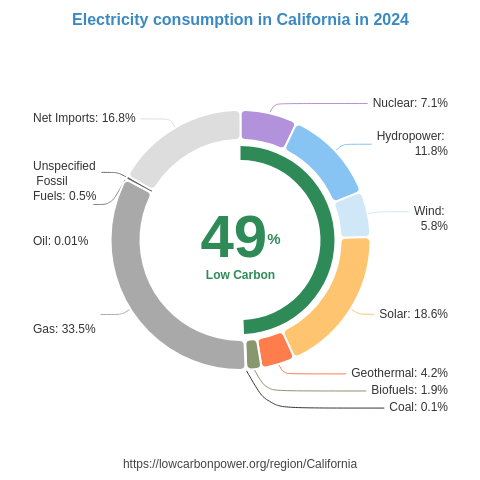
Idaho can build on its existing wind generation while accelerating solar development and considering nuclear electricity. Nearby US states offer useful examples: wind supplies about 31% of electricity generation in Wyoming and 23% in Montana, while solar provides about 35% in Nevada and 20% in Utah. These regional examples show scope for expanding Idaho’s wind and solar contributions. For nuclear, the US state of Arizona generates about a quarter of its electricity from this clean source, while the US state of Illinois generates almost half. Idaho could learn from these regions’ experience in developing a larger, more diverse low-carbon electricity supply, reducing reliance on fossil generation and its associated climate and air-pollution impacts.
* 12M = Last 12 months (Jul 2025 – Jun 2026) — a rolling 12-month period, not a calendar year.
History
The supplied history shows low-carbon electricity gains concentrated in hydropower and wind during 2024–2026. In 2024, hydropower generation increased by 0.8 TWh and wind by 0.7 TWh. Growth continued in 2025, with hydropower adding 0.6 TWh, alongside smaller increases of 0.1 TWh each from wind and biofuels. In 2026, hydropower delivered the largest annual increase listed, at 1.5 TWh, while wind and biofuels showed no change. Geothermal generation was unchanged throughout these three years. Overall, hydropower’s gains are welcome, but wind’s recent stagnation highlights an opportunity to restore momentum and broaden clean electricity growth.
* 12M = Last 12 months (Jul 2025 – Jun 2026) — a rolling 12-month period, not a calendar year.
Electricity Imports and Exports
Balance of Trade
* 12M = Last 12 months (Jul 2025 – Jun 2026) — a rolling 12-month period, not a calendar year.
Nearby Regions