Over the past 12 months, from June 2025 to May 2026, electricity consumption in Poland has shown a significant reliance on fossil energy sources. More than half of Poland's electricity, about 67%, came from fossil fuels, with coal alone contributing over half of the total electricity. On the brighter side, low-carbon electricity sources accounted for nearly a third of the country’s electricity generation. Among these, wind energy accounted for almost 15% and solar energy was responsible for close to 13%. Biofuels and hydropower provided minor contributions to low-carbon energy with around 4% and 2% respectively.
Is Electricity Growing in Poland?
In terms of electricity consumption growth, Poland has seen a concerning stagnation. The latest statistics for 2026 show electricity consumption at 4269 kWh per person, a decrease from the 4596 kWh per person recorded in 2018. This decline of 326 kWh is indicative of a worrying trend where consumption is not growing to meet potential future increases in demand caused by electrification and technological advancements like AI. However, there is a silver lining in the form of low-carbon electricity generation which reached 1393 kWh per person in 2026, surpassing the previous record set in 2025 by 11 kWh. This modest growth showcases the potential for improvement in clean energy sources, though a more aggressive push is vital to match and exceed past consumption records in a sustainable way.
Suggestions
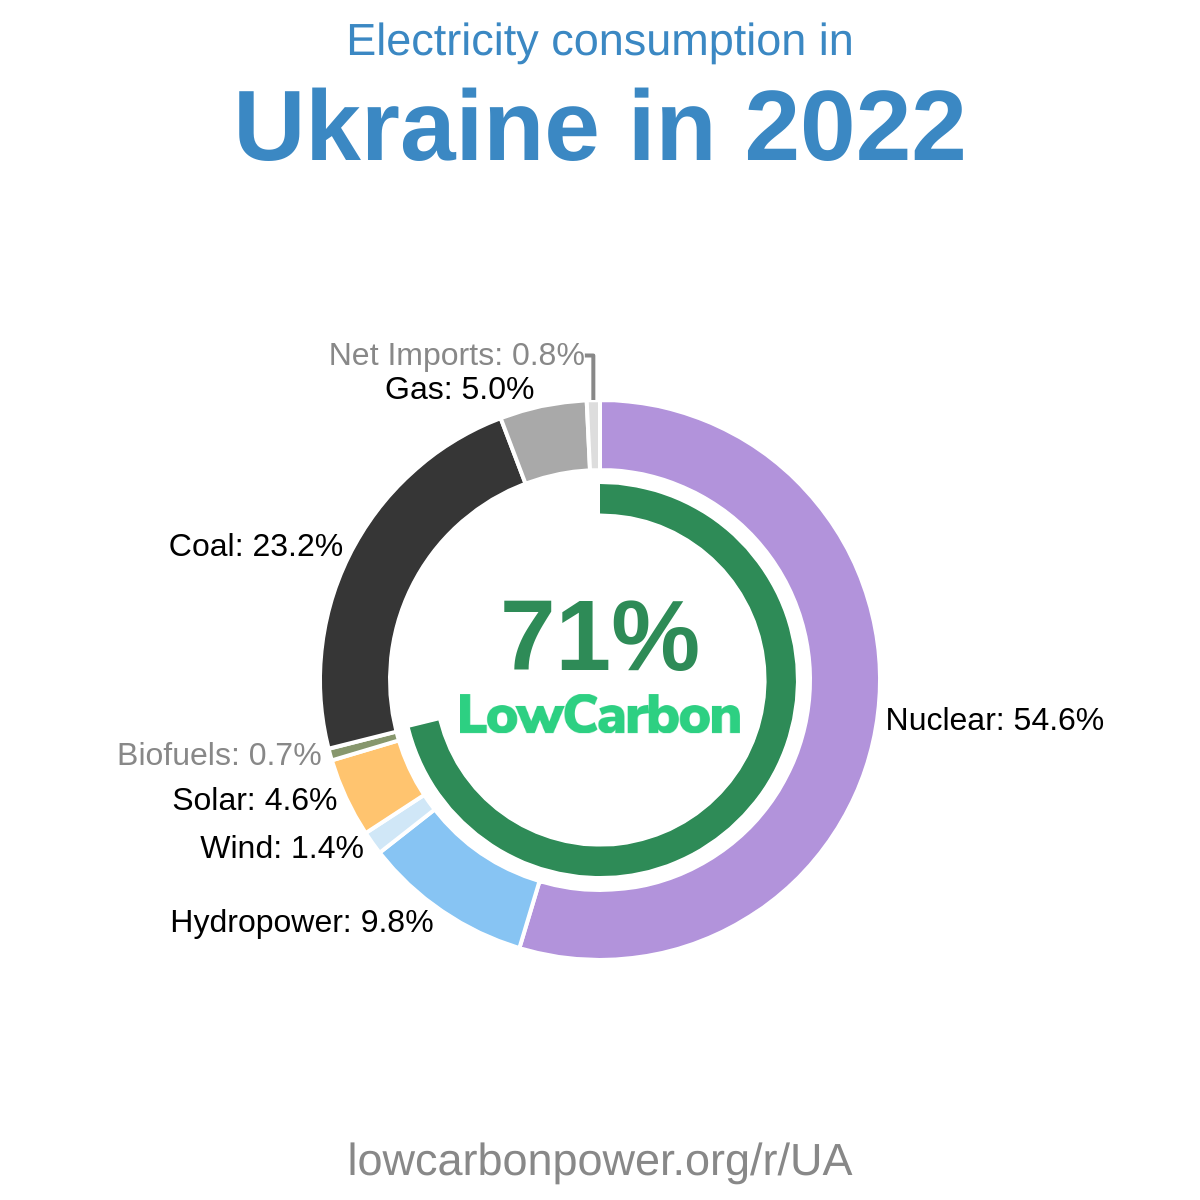
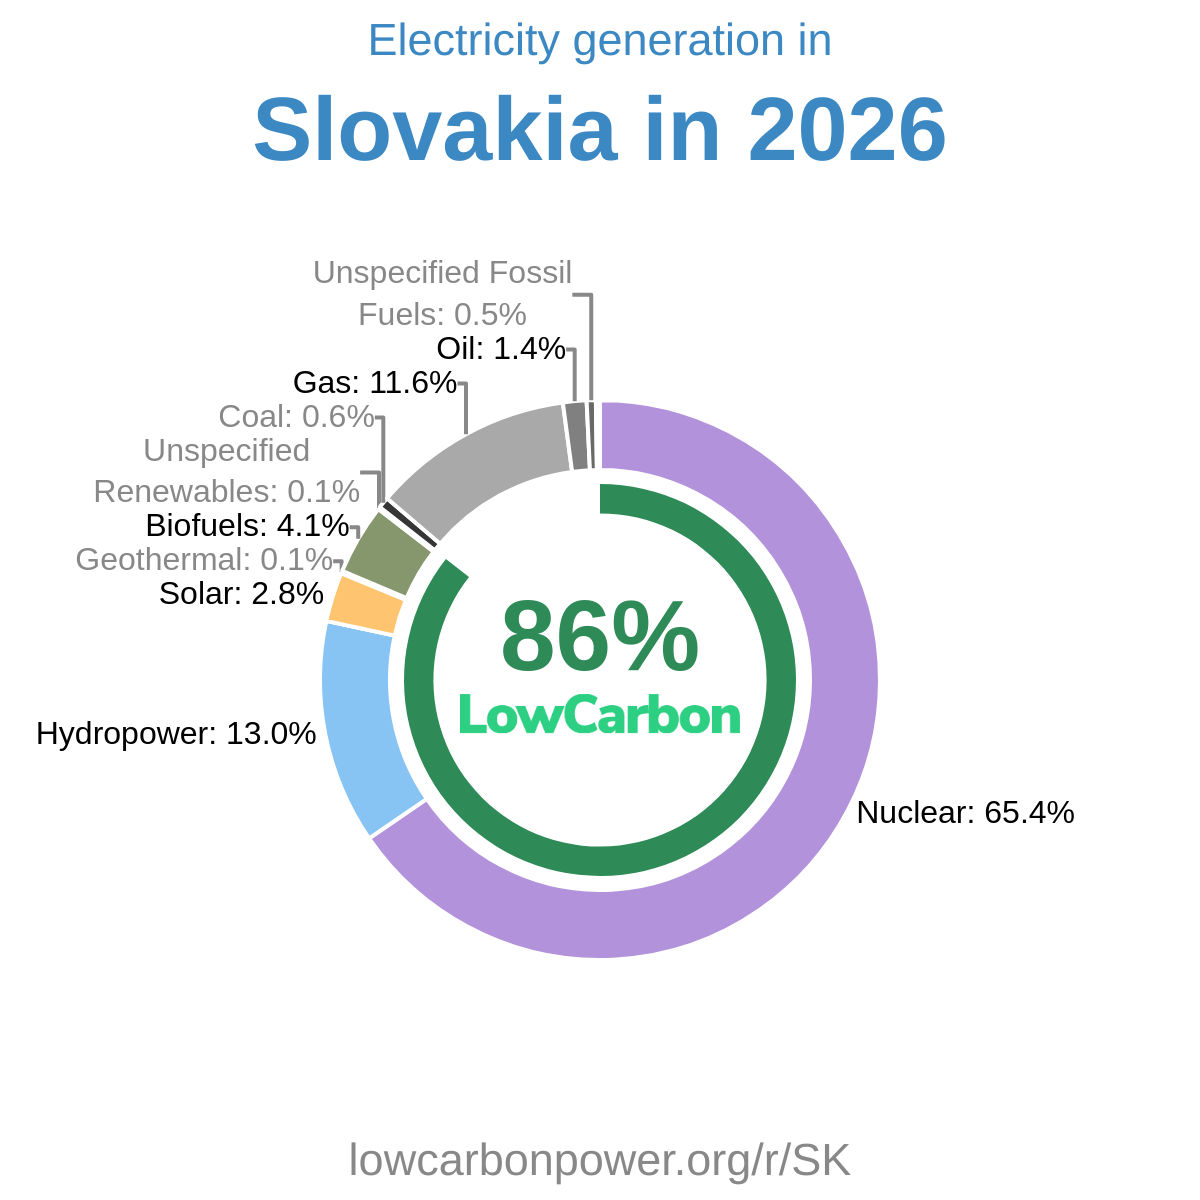
To significantly increase its share of low-carbon electricity, Poland should focus on expanding both wind and solar energy, areas where it already has a commendable foundation. An examination of other regions’ successes provides clear guidance. For instance, countries like Denmark showcase the potential for wind energy, achieving as much as 60% from this source. Additionally, France, Slovakia, and Ukraine, which generate large portions of electricity from nuclear energy—varying between 55% and 67%—offer a roadmap for Poland to develop its nuclear capabilities further. This dual approach of committing to wind and solar expansion while seriously investing in nuclear capacity can significantly reduce reliance on polluting fossil fuels, supporting Poland's transition to a cleaner and more sustainable electricity supply.
* 12M = Last 12 months (Jun 2025 – May 2026) — a rolling 12-month period, not a calendar year.
History
Looking back at the history of low-carbon electricity in Poland, the journey has seen a mix of steps forward and setbacks, particularly in the past few decades. In the early part of the 1990s, hydropower saw a small increase. Fast forward to the 2010s, and wind energy began to gain momentum, with regular yearly increases such as those in 2011, 2012, and from 2014 through 2019, each seeing gains of 1.5 to 3.2 TWh. Although 2018 witnessed a slight decline, wind energy saw significant rises again in 2019 and beyond, notably benefiting from a resurgence with 4.4 TWh in 2023. In the early 2020s, solar power experienced robust growth, especially in 2022 and 2024 when significant increases of 4.4 and 6.6 TWh were recorded. These trends demonstrate that strategic investments in sustainable, clean energy like solar and wind can yield substantial results, enabling Poland to progress toward a more low-carbon future.
* 12M = Last 12 months (Jun 2025 – May 2026) — a rolling 12-month period, not a calendar year.
Electricity Imports and Exports
Balance of Trade
* 12M = Last 12 months (Jun 2025 – May 2026) — a rolling 12-month period, not a calendar year.
Nearby Regions