From July 2025 through June 2026, fossil fuels supplied about 58% of Missouri’s electricity consumption, with coal accounting for almost 47% and gas for about 11%. Low-carbon electricity supplied roughly a quarter: nuclear contributed 11%, wind 8%, solar 4%, and hydropower just over 1%. Utility-scale solar alone accounted for about 3% of consumption. Net imports supplied the remaining roughly 18%; the data do not identify their generation mix, so they should not be classified as either clean or fossil electricity. Missouri therefore still relies heavily on fossil fuels, leaving substantial room for clean electricity to reduce climate-changing emissions and air pollution.
Is Electricity Growing in Missouri?
Electricity consumption per person is growing, although only modestly. The latest 2026 figure reached about 14,214 kWh per person, exceeding the previous record of 14,151 kWh in 2025 by 63 kWh, or about 0.4%. Low-carbon electricity generation made a much stronger advance, reaching 3,483 kWh per person—354 kWh, or about 11%, above its previous record set in 2024. These are encouraging new highs, particularly for clean electricity. However, per-person figures alone do not establish the change in statewide total consumption. Sustained expansion of clean electricity would help Missouri meet future demand from electrification and AI.
Suggestions
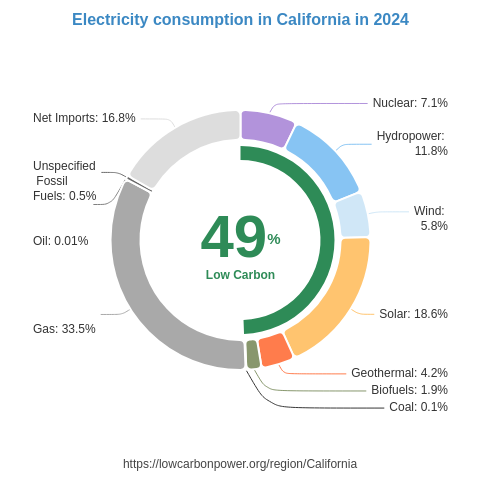
Missouri can build on its existing nuclear generation by expanding capacity at its existing nuclear site and considering additional reactors, alongside substantial solar and wind development. Nearby regions offer useful examples: the US state of Illinois generates almost half its electricity from nuclear, while the US state of Tennessee generates almost a third. France, where nuclear supplies about two-thirds of electricity generation, offers another example of large-scale clean electricity production. For wind, Missouri can learn from neighboring US states Iowa and Kansas, where wind supplies about 57% and 49% of generation, respectively. Solar also has considerable room to grow: the US states of Nevada and California generate about 35% and 31% of their electricity from solar. These examples provide benchmarks rather than automatic targets, but they demonstrate the scope for a much larger low-carbon electricity supply.
* 12M = Last 12 months (Jul 2025 – Jun 2026) — a rolling 12-month period, not a calendar year.
History
The supplied history covers 2024–2026 and shows an overall increase in low-carbon electricity generation across those annual changes. Nuclear added 1.3 TWh in 2024 and delivered a strong 2.7 TWh increase in 2026; its cumulative change over the three years was a gain of 0.6 TWh. Wind generation was unchanged in 2024, fell by 0.3 TWh in 2025, and then increased by 0.6 TWh in 2026, producing a net gain of 0.3 TWh. Hydropower added 0.4 TWh in 2024 and remained unchanged in the following two years, while low-carbon biofuel generation recorded no change throughout the period. The strong nuclear and wind gains in 2026 are welcome progress that Missouri should build on through sustained clean electricity expansion.
* 12M = Last 12 months (Jul 2025 – Jun 2026) — a rolling 12-month period, not a calendar year.
Electricity Imports and Exports
Balance of Trade
* 12M = Last 12 months (Jul 2025 – Jun 2026) — a rolling 12-month period, not a calendar year.
Nearby Regions


.png)