

From September 2025 through August 2026, fossil fuels supplied almost two-thirds of Arkansas’s electricity consumption, while low-carbon sources provided a little over one-third. Gas accounted for about 36% and coal for 27%. Nuclear was the largest clean electricity source, supplying roughly 20% of the total, followed by solar at 9%, hydropower at nearly 5%, and biofuels at just over 1%. Utility-scale solar alone contributed about 8%, accounting for most solar electricity. Arkansas therefore has a substantial clean electricity foundation, but fossil fuels still dominate its electricity mix, contributing to climate change and air pollution.
Is Electricity Growing in Arkansas?
Electricity consumption per person is not currently growing: the latest 2026 figure was about 22,200 kWh per person, down 115 kWh, or roughly 0.5%, from the 2025 record. Low-carbon electricity generation also slipped, reaching about 8,100 kWh per person, down 131 kWh, or around 1.6%, from its 2025 peak. These figures show a modest retreat rather than continued growth on a per-person basis; they do not establish whether statewide total consumption increased or decreased. The decline in clean electricity generation deserves attention, particularly as electrification and AI create additional electricity demand.
Suggestions
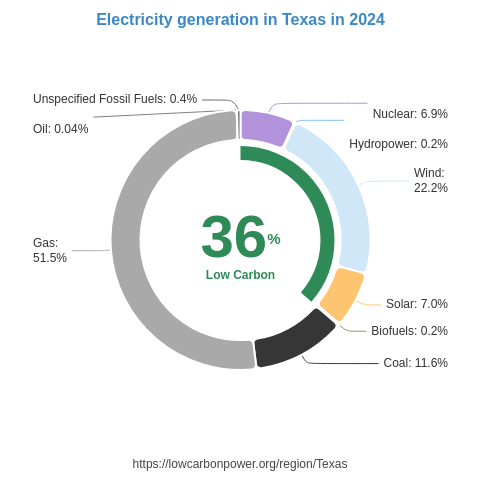
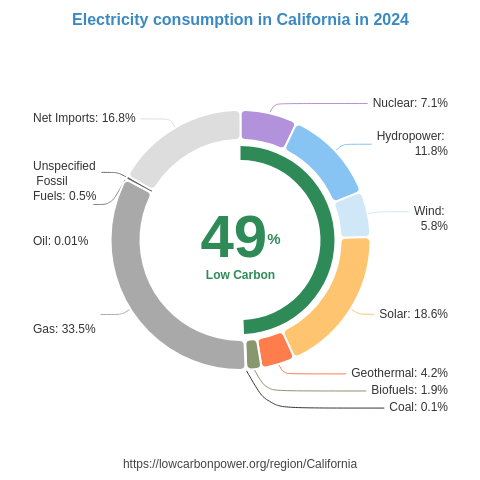
Arkansas can build on its existing nuclear fleet by expanding generation at existing facilities where feasible and planning additional nuclear capacity, alongside faster solar deployment. Nearby examples offer useful lessons: the US state of Tennessee generates 32% of its electricity from nuclear, while the US state of South Carolina reaches 52%, demonstrating the potential for a much larger nuclear contribution. For solar, Arkansas could study deployment approaches in the US states of Nevada and Arizona, where solar supplies 33% and 19% of electricity, respectively. Wind could provide another clean electricity complement: neighboring Oklahoma generates 45% of its electricity from wind, while nearby Kansas reaches 49%. Learning from these regions, while accounting for local conditions, could help Arkansas expand clean electricity generation and reduce fossil-fuel dependence.
* 12M = Last 12 months (Sep 2025 – Aug 2026) — a rolling 12-month period, not a calendar year.
History
The supplied history shows mixed progress between 2024 and 2026. In 2024, nuclear generation fell by 0.2 TWh and hydropower by 0.1 TWh, while biofuels rose by 0.1 TWh. Conditions improved in 2025, with hydropower gaining 0.8 TWh and nuclear adding 0.4 TWh; biofuels remained unchanged. In 2026, however, nuclear generation declined by 1.1 TWh and hydropower by 0.6 TWh, outweighing a welcome 0.4 TWh increase in wind generation, while biofuels again stayed flat. That overall clean electricity setback is disappointing and underscores the importance of sustaining existing low-carbon output while accelerating nuclear, solar, and other clean electricity additions.
* 12M = Last 12 months (Sep 2025 – Aug 2026) — a rolling 12-month period, not a calendar year.
Electricity Imports and Exports
Balance of Trade
* 12M = Last 12 months (Sep 2025 – Aug 2026) — a rolling 12-month period, not a calendar year.
Nearby Regions