

From September 2025 through August 2026, Vermont relied on net imports for almost two-thirds of its electricity consumption, while in-state low-carbon generation supplied about 36%. Hydropower contributed roughly 14%, solar 10%, biofuels 6%, and wind another 6%. Solar’s contribution included about 7% from behind-the-meter systems and 3% from utility-scale installations. In-state fossil electricity generation was close to zero. However, the data do not identify the sources of imported electricity, so those imports cannot all be classified as either low-carbon or fossil electricity.
Is Electricity Growing in Vermont?
Electricity consumption in Vermont is growing: the latest 2026 figure reached about 9,750 kWh per person, exceeding the previous record set in 2024 by approximately 500 kWh per person, or 5%. That growth is encouraging as electrification and AI increase electricity needs. However, local clean electricity generation is not keeping pace. Low-carbon generation reached about 3,490 kWh per person, roughly 690 kWh below its 2023 record—a decline of about 17%. This disappointing gap highlights the need to expand clean generation alongside rising consumption.
Suggestions
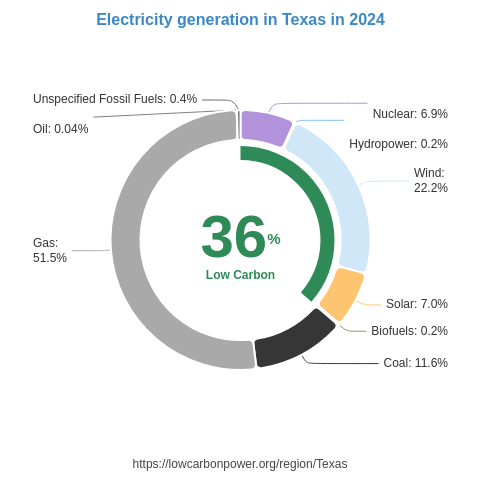
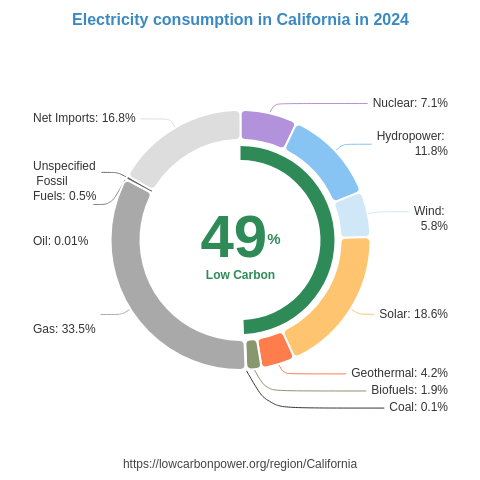
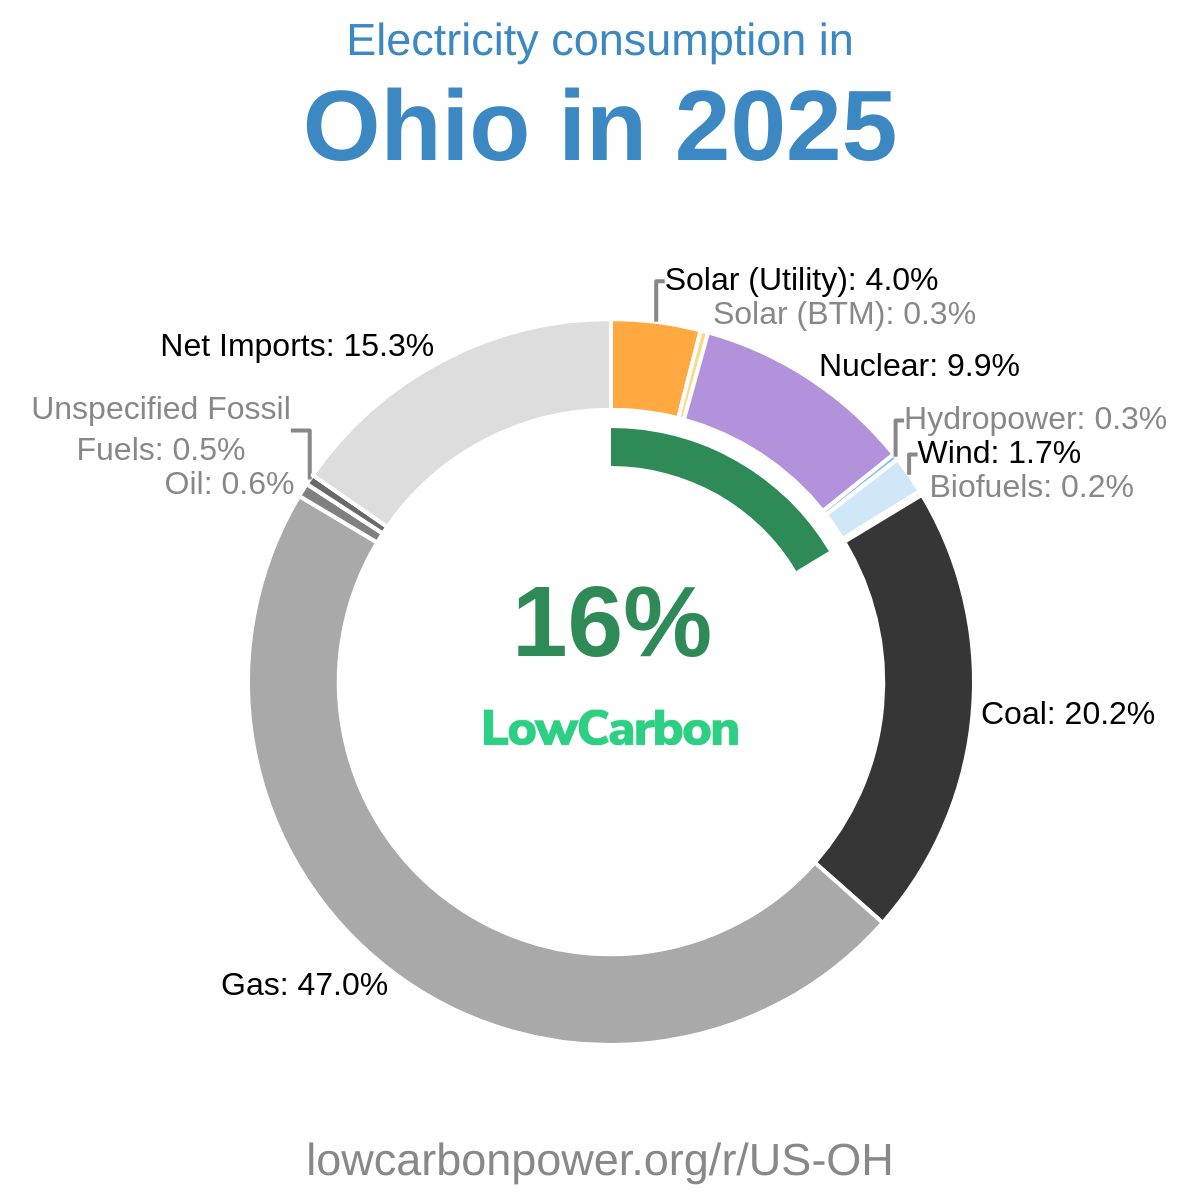
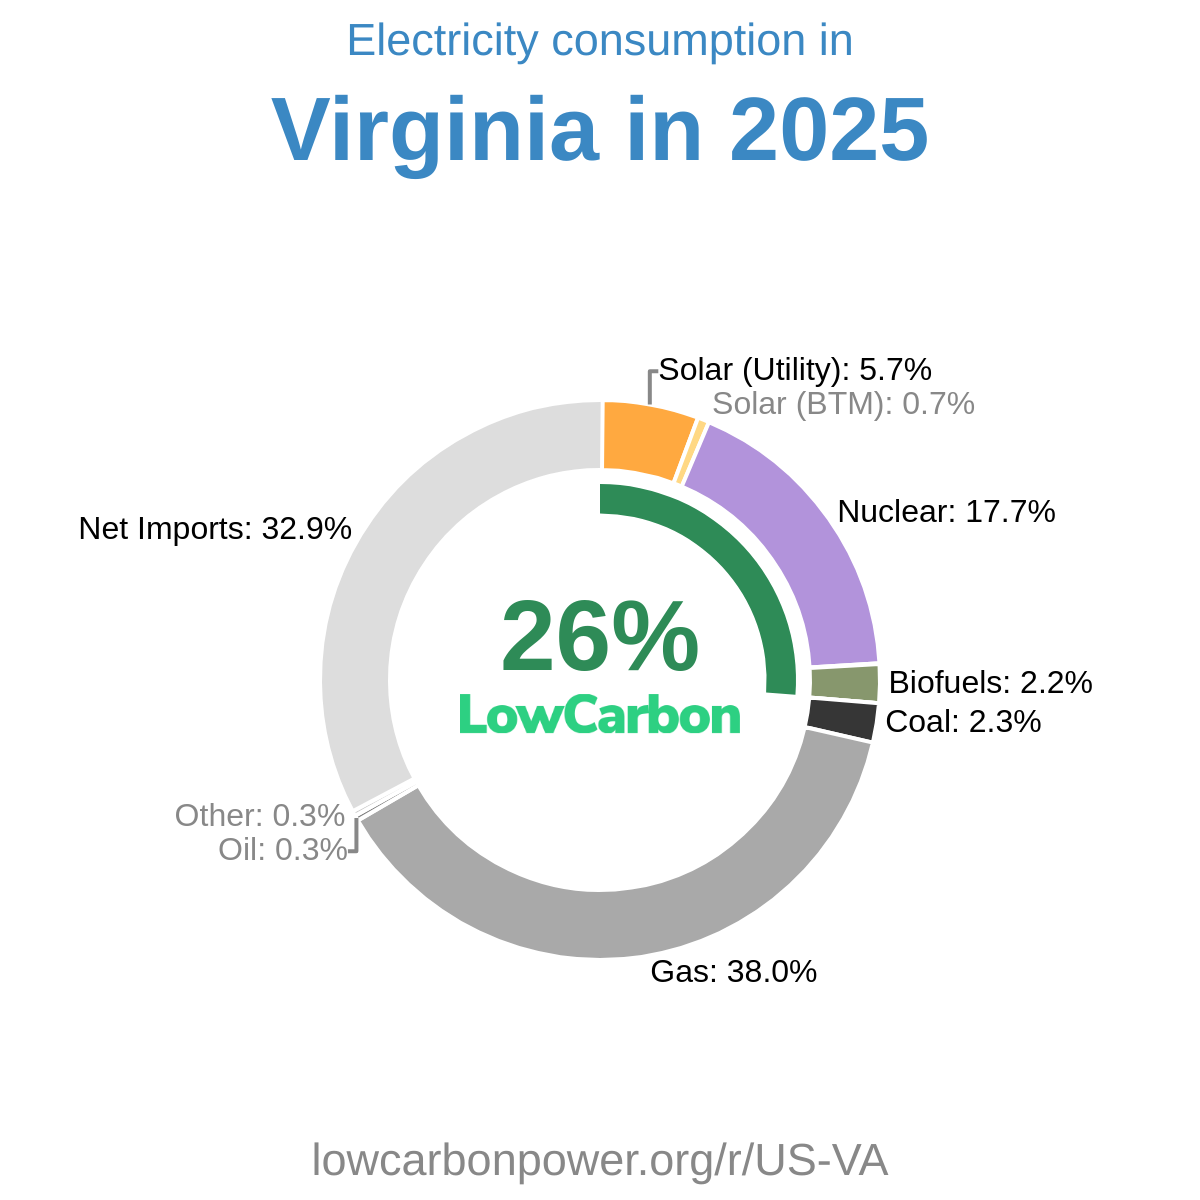
Vermont can build on solar’s existing contribution by expanding rooftop, community, and utility-scale solar. Among useful reference regions, the US states of California and Nevada generate about a third of their electricity from solar, while Latvia generates about a fifth, demonstrating solar’s potential across different settings. Nearby nuclear experience is especially relevant: the US state of New Hampshire generates more than half of its electricity from nuclear, and the US state of Connecticut generates more than a third. Vermont should consider new nuclear generation alongside solar expansion to strengthen its clean electricity supply. It can also learn from the US state of Maine, where wind supplies about a fifth of electricity generation, when assessing additional wind development.
* 12M = Last 12 months (Sep 2025 – Aug 2026) — a rolling 12-month period, not a calendar year.
History
The supplied history shows a troubling pattern of declining hydropower and stagnant wind and biofuel generation from 2024 through 2026. Hydropower generation fell by about 0.3 TWh in both 2024 and 2025, followed by another 0.1 TWh decline in 2026—a cumulative reduction of roughly 0.7 TWh. Wind and biofuel generation recorded no year-on-year change throughout those three years. These figures show no growth from the listed sources to offset hydropower’s losses, reinforcing the importance of expanding solar and developing additional clean electricity generation, including nuclear.
* 12M = Last 12 months (Sep 2025 – Aug 2026) — a rolling 12-month period, not a calendar year.
Electricity Imports and Exports
Balance of Trade
* 12M = Last 12 months (Sep 2025 – Aug 2026) — a rolling 12-month period, not a calendar year.
Nearby Regions