From July 2025 through June 2026, low-carbon generation supplied about 40% of Tennessee’s electricity consumption, while fossil generation supplied about 29%. Net imports accounted for the remaining 31%; the data do not identify the sources behind those imports. Nuclear was Tennessee’s largest local source, supplying almost a third of electricity consumption, followed by hydropower at about 6% and solar at roughly 2%. Coal and gas each supplied around 15%, making fossil fuels a substantial part of the electricity mix.
Is Electricity Growing in Tennessee?
Electricity consumption per person is growing modestly. The latest 2026 figure reached 16,160 kWh per person, exceeding the previous record of 15,996 kWh in 2025 by 164 kWh, or about 1%. Low-carbon electricity generation, however, has not yet surpassed its historic peak: at 6,461 kWh per person, it remained 104 kWh—about 2%—below the 2023 record. That shortfall is concerning: Tennessee needs clean electricity generation to grow alongside consumption, supporting electrification and rising demand from AI while reducing dependence on fossil fuels.
Suggestions
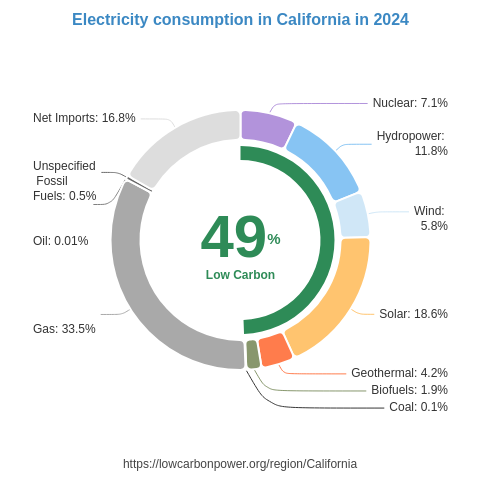
Tennessee should build on its substantial nuclear foundation by expanding existing nuclear capacity and pursuing additional nuclear generation, alongside a major solar buildout. Nearby South Carolina offers a particularly relevant example: nuclear supplies about 52% of electricity generation in that US state, compared with roughly 32% of Tennessee’s consumption. The US state of Illinois also demonstrates a strong nuclear contribution, at 49%, while France reaches 67%. For solar, Tennessee could study the deployment approaches of the US states of Texas and California, where solar supplies about 12% and 31% of generation, respectively, while adapting those lessons to local conditions. These comparisons use generation shares, rather than Tennessee’s consumption-based shares, but illustrate the scope for expanding clean electricity.
* 12M = Last 12 months (Jul 2025 – Jun 2026) — a rolling 12-month period, not a calendar year.
History
Tennessee’s recent low-carbon electricity history highlights the importance of sustained growth rather than isolated strong years. Hydropower added 0.9 TWh in 2024, while nuclear delivered a substantial 8.2 TWh increase in 2026—a welcome boost to clean electricity production. Biofuel generation showed no year-to-year change throughout 2024–2026, and wind generation was unchanged in the reported 2024 data. Across this period, the priority should be to turn strong gains into lasting progress through sustained nuclear output and faster solar expansion, helping clean electricity meet growing consumption and displace fossil generation associated with climate change and air pollution.
* 12M = Last 12 months (Jul 2025 – Jun 2026) — a rolling 12-month period, not a calendar year.
Electricity Imports and Exports
Balance of Trade
* 12M = Last 12 months (Jul 2025 – Jun 2026) — a rolling 12-month period, not a calendar year.
Nearby Regions


.png)