From July 2025 through June 2026, fossil fuels supplied almost four-fifths of Indiana’s electricity consumption. Coal accounted for about 41% and gas for 35%, making them the dominant sources. Low-carbon electricity supplied nearly 18%, led by wind at about 9% and solar at nearly 8%. Utility-scale solar contributed most of that solar electricity, accounting for about 7% of total consumption. Net imports supplied another 3%; their carbon profile is not specified in the data. Indiana therefore still relies heavily on fossil electricity, with substantial room to expand clean generation and reduce climate-changing emissions and air pollution.
Is Electricity Growing in Indiana?
Electricity consumption in Indiana is growing: the latest 2026 figure reached about 16,650 kWh per person, exceeding the previous record of roughly 16,370 kWh in 2025. That is an increase of about 280 kWh per person, or nearly 2%. Low-carbon electricity generation grew faster, reaching about 2,930 kWh per person—roughly 340 kWh above its 2025 record, an increase of about 13%. These new records are encouraging, especially the stronger growth in clean electricity, although further expansion will be needed to support electrification and growing demand from AI.
Suggestions
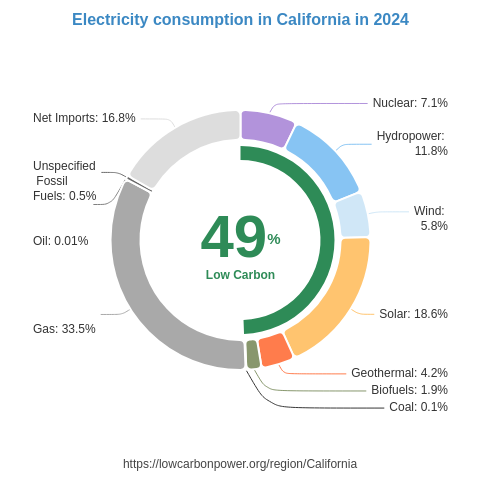
Indiana can increase low-carbon electricity generation by expanding solar and wind while developing nuclear power. Neighboring Illinois provides a particularly relevant example: the US state generates nearly half its electricity from nuclear, while nearby Michigan obtains about a fifth from it. France, where nuclear supplies about two-thirds of electricity generation, offers another example of nuclear’s potential contribution. For wind, Indiana can learn from the US states of Iowa and Kansas, where wind supplies about 57% and 49% of generation, respectively. For solar, the US states of Nevada and California demonstrate substantial deployment, generating about 35% and 31% of their electricity from solar. Indiana should adapt these examples to local conditions, accelerating utility-scale and rooftop solar, expanding wind, and planning nuclear generation alongside the grid infrastructure needed to deliver more clean electricity.
* 12M = Last 12 months (Jul 2025 – Jun 2026) — a rolling 12-month period, not a calendar year.
History
The supplied history covers 2024 through 2026 and shows wind driving the recorded increases in Indiana’s low-carbon electricity generation. In 2024, wind generation rose by 1.5 TWh, more than offsetting small declines of 0.1 TWh each in hydro and biofuels. In 2025, wind, hydro and biofuels all remained unchanged—a disappointing pause in growth among these sources. Wind resumed its expansion in 2026, adding 0.6 TWh, while hydro and biofuels again remained steady. This renewed growth is welcome, but a sustained expansion across wind, solar and nuclear would build a stronger foundation for Indiana’s clean electricity future; the supplied historical figures do not show changes in solar or nuclear generation.
* 12M = Last 12 months (Jul 2025 – Jun 2026) — a rolling 12-month period, not a calendar year.
Electricity Imports and Exports
Balance of Trade
* 12M = Last 12 months (Jul 2025 – Jun 2026) — a rolling 12-month period, not a calendar year.
Nearby Regions


.png)