From September 2025 through August 2026, just over half of Belgium’s electricity consumption was supplied by low-carbon generation, while fossil generation supplied almost a quarter and net imports accounted for about 23%. Wind provided around 18%, solar 15%, and nuclear 14%, making these the main sources of clean electricity. Biofuels contributed about 4% and hydropower nearly 2%. Among fossil sources, gas supplied about 20% and coal just over 2%. The substantial fossil share leaves considerable scope for more low-carbon electricity to reduce climate-changing emissions and air pollution.
Is Electricity Growing in Belgium?
Belgium’s latest figures do not show growth relative to its historical peaks, although these comparisons alone cannot establish the latest year-on-year trend. Electricity consumption in 2026 was about 6,500 kWh per person, roughly 2,600 kWh—or 28%—below the record of about 9,100 kWh in 2006. Low-carbon electricity generation stood at about 3,450 kWh per person, around 2,640 kWh—or 43%—below its 2021 record. This retreat in clean electricity generation is particularly concerning: Belgium needs a stronger electricity supply to support electrification and growing demand from AI and other digital services.
Suggestions
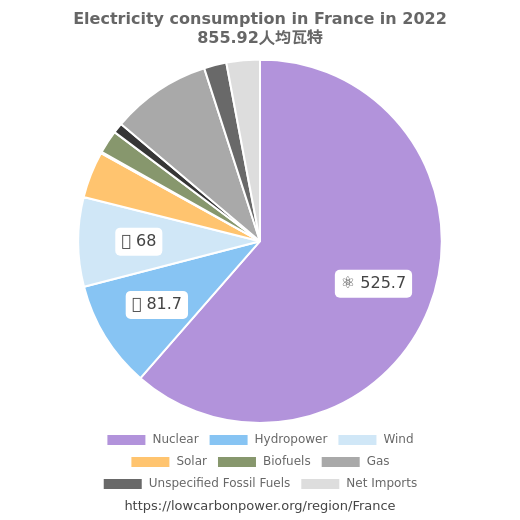
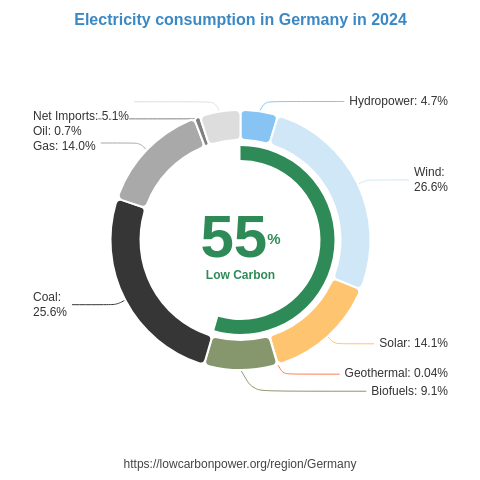
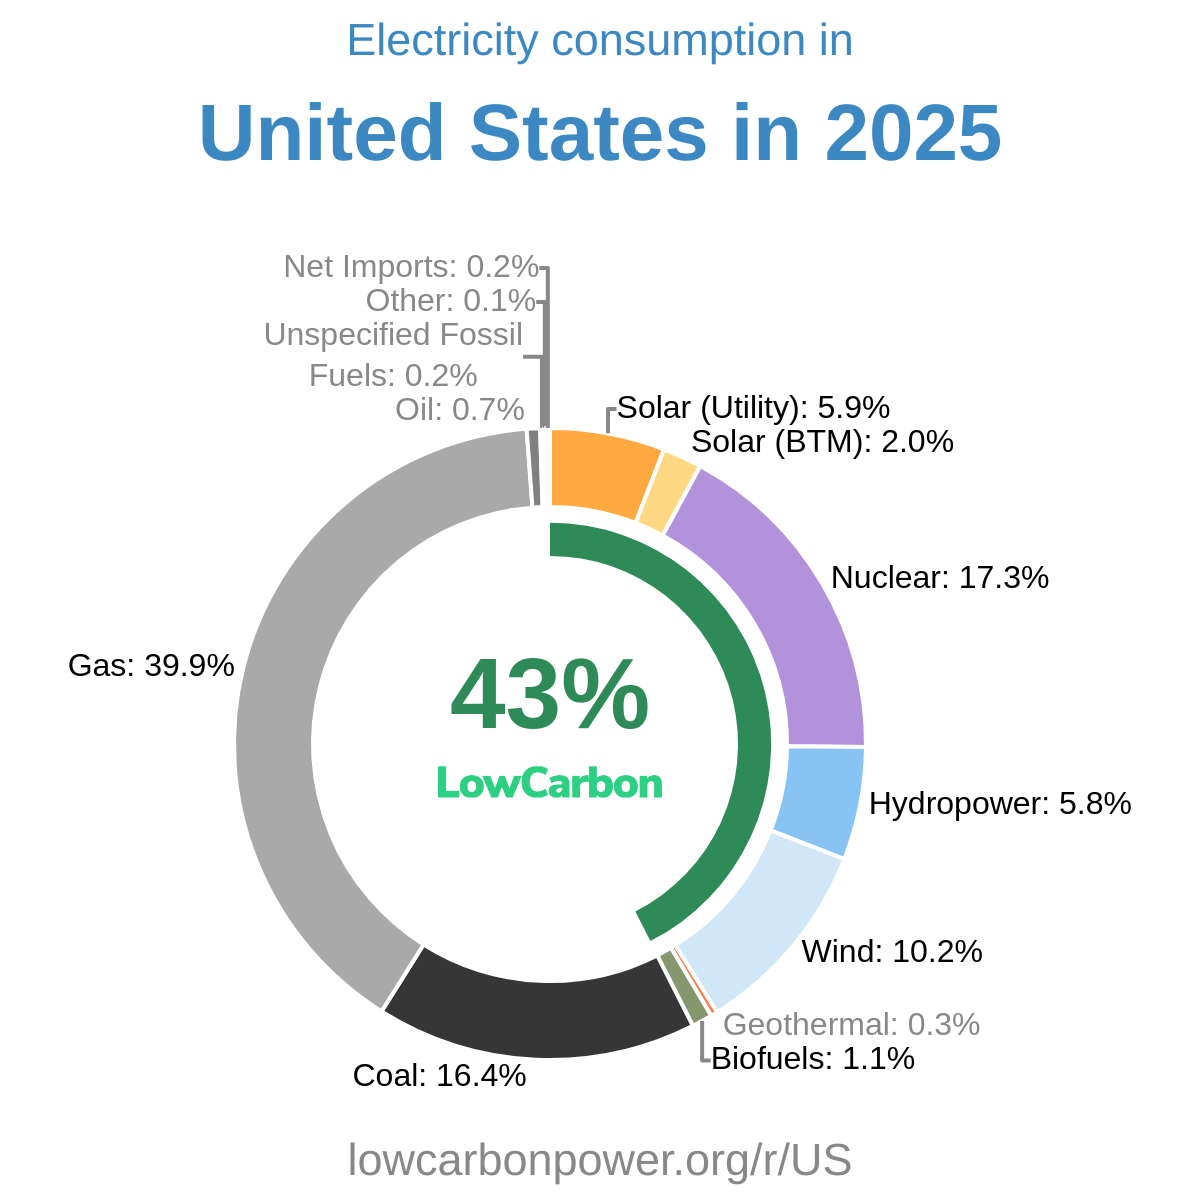
Belgium should expand its existing nuclear, wind, and solar generation, building on technologies that already provide substantial amounts of its electricity. Neighbouring France, where nuclear generates about two-thirds of electricity, offers a particularly relevant example of the scale achievable with nuclear power; Slovakia reaches a similar share. For wind, Belgium can learn from Denmark, which generates more than half its electricity from wind, and nearby Germany and the United Kingdom, where wind supplies around a third. For solar, the US states of California and Nevada demonstrate substantial contributions of roughly 31% and 35%, respectively. Their results offer useful lessons in deploying solar at scale, adapted to Belgium’s local conditions. Combining these clean technologies with stronger grids and flexibility would help Belgium increase domestic low-carbon generation.
* 12M = Last 12 months (Sep 2025 – Aug 2026) — a rolling 12-month period, not a calendar year.
History
Belgium’s low-carbon electricity history shows major nuclear expansion followed by sharp fluctuations and substantial recent losses. Nuclear generation increased by about 10 TWh across 1975–1976, then added nearly 24 TWh through the annual gains recorded in 1983–1986; another increase of about 4 TWh came in 1997. The 2010s brought a troubling sequence of setbacks: declines of roughly 8 TWh in 2012, 9 TWh in 2014, and 8 TWh in 2015, followed by a strong 17 TWh rebound in 2016. A nearly 14 TWh fall in 2018 was followed by a 15 TWh recovery in 2019. That instability continued with an 11 TWh decline in 2020 and a 15 TWh rebound in 2021. Subsequent nuclear losses—about 6 TWh in 2022, 10 TWh in 2023, 7 TWh in 2025, and 11 TWh in 2026—represent a deeply disappointing erosion of clean electricity supply. Wind’s roughly 3 TWh increase in 2023 was welcome, but did not offset that year’s nuclear decline, underscoring the need to preserve and expand nuclear generation alongside faster wind and solar growth.
* 12M = Last 12 months (Sep 2025 – Aug 2026) — a rolling 12-month period, not a calendar year.
Electricity Imports and Exports
Balance of Trade
* 12M = Last 12 months (Sep 2025 – Aug 2026) — a rolling 12-month period, not a calendar year.
Nearby Regions