

From July 2025 through June 2026, fossil fuels supplied nearly half of North Carolina’s electricity consumption, while low-carbon sources supplied about 40%. Gas accounted for around 36% and coal for 12%. Nuclear was the largest clean electricity source, supplying 27% of consumption, followed by solar at 9%—mostly utility-scale installations—and hydropower at nearly 3%. Net imports supplied another 11%; their source mix is not specified, so they cannot be classified as either clean or fossil electricity from these data.
Is Electricity Growing in North Carolina?
Electricity consumption per person is growing, but only slightly. The latest 2026 figure reached 13,890 kWh per person, just 31 kWh above the previous record of 13,859 kWh in 2025—an increase of about 0.2%. Low-carbon electricity generation moved in the opposite direction, falling to 5,618 kWh per person, roughly 100 kWh below its 2025 record, or almost 2%. This clean electricity decline is concerning: North Carolina needs stronger growth in low-carbon generation to meet expanding demand from electrification and AI while reducing reliance on fossil fuels, which contribute to climate change and air pollution.
Suggestions
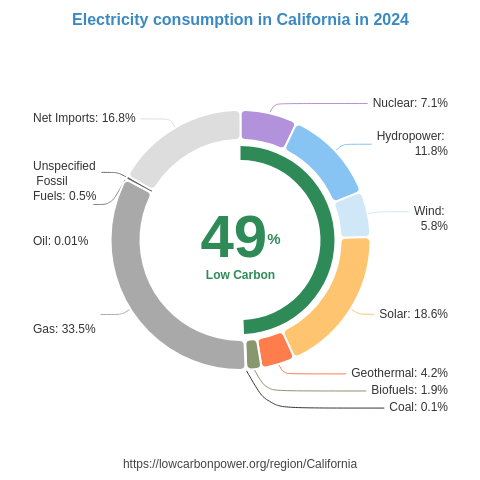
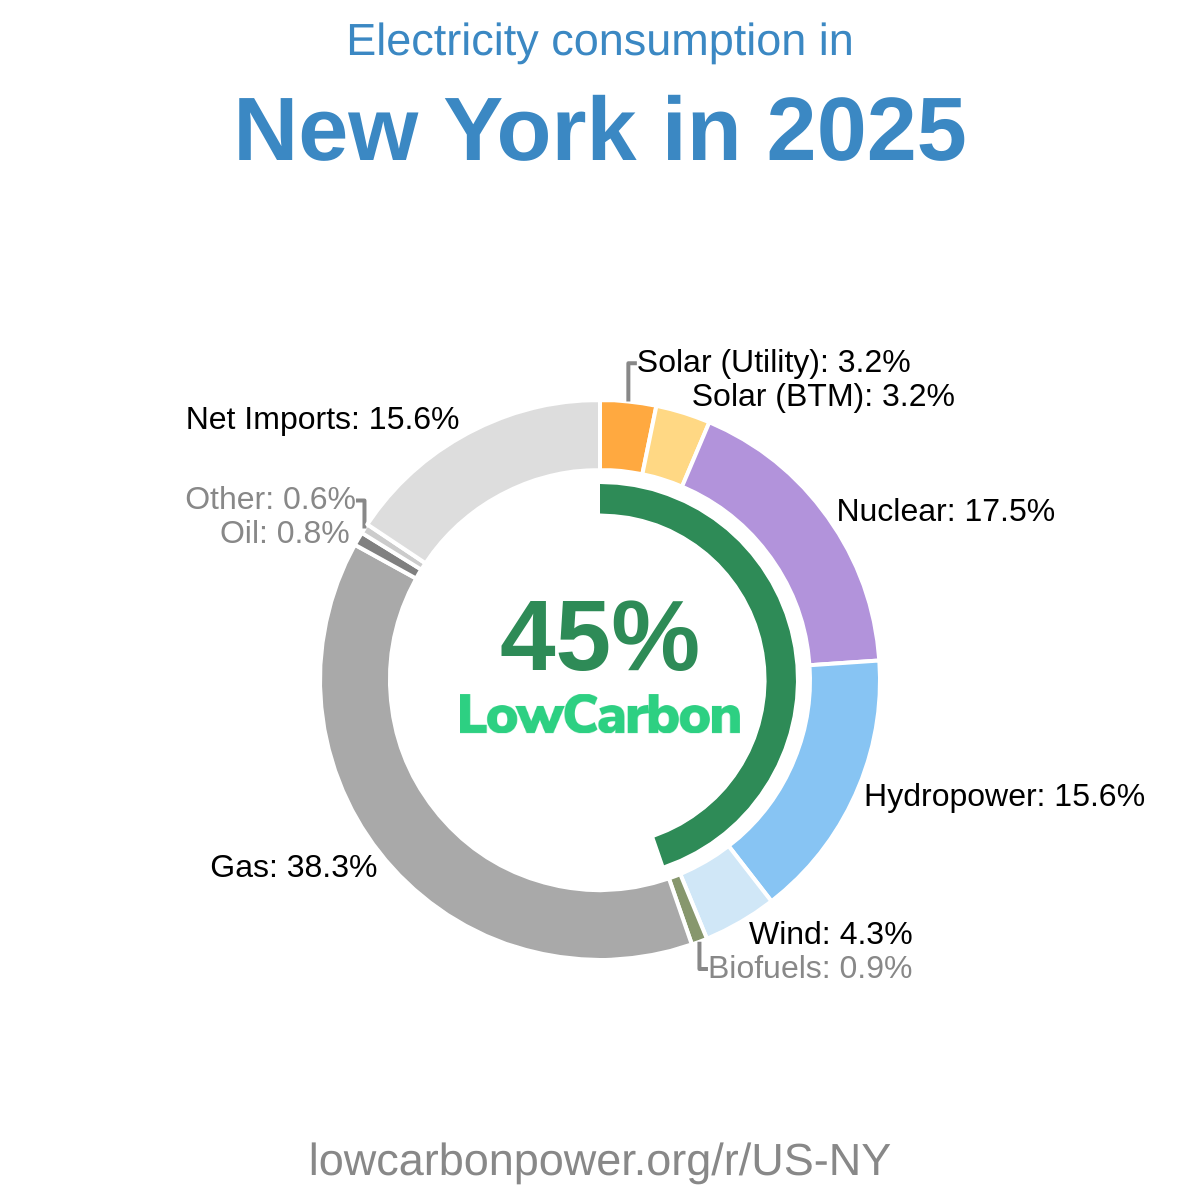
North Carolina should expand its existing nuclear generation through capacity upgrades and additional reactors at established sites, while accelerating utility-scale and rooftop solar. Nearby South Carolina offers a particularly relevant example: nuclear supplies 52% of electricity generation in that US state, compared with North Carolina’s nuclear contribution equivalent to 27% of consumption. France, where nuclear provides 67% of generation, also demonstrates the substantial role this clean technology can play. For solar, the US states of Nevada and California generate 35% and 31% of their electricity from sunlight, respectively, offering useful lessons for scaling deployment. Wind can complement these sources: the US state of Iowa generates 57% of its electricity from wind, illustrating the contribution possible where local conditions support development.
* 12M = Last 12 months (Jul 2025 – Jun 2026) — a rolling 12-month period, not a calendar year.
History
The supplied history covers 2024–2026 and shows an encouraging start followed by disappointing setbacks. In 2024, nuclear generation increased by 1 TWh and hydropower by 0.6 TWh, while wind was unchanged and biofuels declined slightly. In 2025–2026, nuclear generation fell by 0.3 TWh and then 0.9 TWh, while hydropower declined by 0.2 TWh and then 0.5 TWh. Those nuclear reductions reversed the previous year’s gain and represent a concerning loss of clean electricity output that North Carolina should work to recover. Wind added 0.4 TWh in 2025 but recorded no further growth in 2026, while biofuels saw small, offsetting changes. Overall, these recent setbacks underscore the need for sustained expansion of nuclear, solar, and other low-carbon electricity sources.
* 12M = Last 12 months (Jul 2025 – Jun 2026) — a rolling 12-month period, not a calendar year.
Electricity Imports and Exports
Balance of Trade
* 12M = Last 12 months (Jul 2025 – Jun 2026) — a rolling 12-month period, not a calendar year.
Nearby Regions