

From July 2025 through June 2026, nearly two-thirds of Kansas’s electricity came from low-carbon sources, while just over a third came from fossil fuels. Wind supplied almost half of all electricity, and nuclear contributed about 15%, making these the backbone of Kansas’s clean electricity supply. Solar provided roughly 1.5%, including about 1% from utility-scale installations. Among fossil sources, coal supplied 28% of electricity and gas about 6%. Kansas already has a strong low-carbon foundation, but replacing its remaining fossil-fueled electricity would help reduce climate-changing emissions and air pollution.
Is Electricity Growing in Kansas?
Electricity consumption in Kansas is growing, although only slightly on a per-person basis. The latest 2026 figure reached about 21,400 kWh per person, exceeding the previous record set in 2025 by 108 kWh, or around 0.5%. Low-carbon electricity generation grew more strongly, reaching almost 14,000 kWh per person—roughly 620 kWh, or nearly 5%, above its previous record in 2025. These new highs are encouraging, particularly the faster growth in clean electricity. However, the modest increase in consumption per person does not by itself establish how much statewide consumption grew; stronger clean electricity expansion would help meet future demand from electrification and AI.
Suggestions
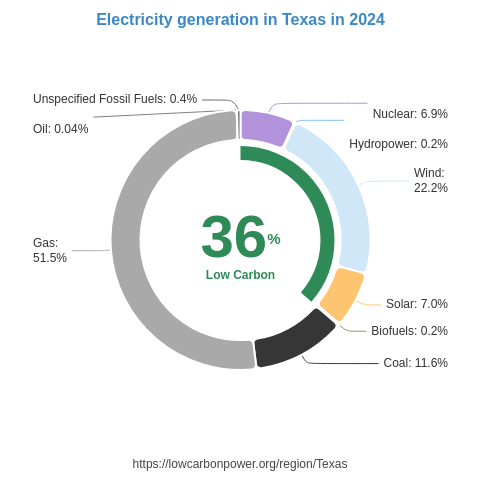
Kansas should build on its substantial wind generation, expand existing nuclear generation where feasible, and accelerate solar development. Nearby examples offer useful benchmarks: the US state of Illinois generates about half its electricity from nuclear, demonstrating the substantial contribution nuclear can make to a regional electricity supply. France provides another example, with roughly two-thirds of its electricity generated by nuclear. For solar, Kansas can look to the US states of Colorado and Texas, where solar supplies about 14% and 12% of electricity, respectively, compared with Kansas’s roughly 1.5%. Combining more wind with expanded nuclear and solar generation would strengthen Kansas’s clean electricity supply and support growing electricity demand.
* 12M = Last 12 months (Jul 2025 – Jun 2026) — a rolling 12-month period, not a calendar year.
History
The available history covers 2024 through 2026 and shows wind driving the largest recent increases in low-carbon electricity generation. Wind generation rose by 2.5 TWh in 2024, slipped slightly by 0.2 TWh in 2025, and rebounded strongly with a 1.6 TWh increase in 2026—a net gain of 3.9 TWh across the three years. Nuclear generation increased by 0.1 TWh in 2025 and remained unchanged in 2026, underscoring the opportunity for renewed expansion. Hydro and biofuel generation showed no changes throughout the period. Sustaining wind’s momentum while increasing nuclear and solar output would give Kansas a stronger foundation for continued clean electricity growth.
* 12M = Last 12 months (Jul 2025 – Jun 2026) — a rolling 12-month period, not a calendar year.
Electricity Imports and Exports
Balance of Trade
* 12M = Last 12 months (Jul 2025 – Jun 2026) — a rolling 12-month period, not a calendar year.
Nearby Regions