From October 2025 through September 2026, low-carbon sources supplied about 71% of Austria’s electricity consumption. Hydropower was the largest source at roughly 40%, followed by solar at 14%, wind at 12%, and biofuels at 5%. Fossil fuels supplied about 15%, mostly gas at nearly 12%, with coal contributing around 2%. Net imports accounted for another 14%; their generation mix is not specified, so they should not automatically be classified as either clean or fossil electricity.
Is Electricity Growing in Austria?
Austria’s latest figures do not show growth relative to its historical per-person peaks. Electricity consumption in 2026 was about 8,200 kWh per person, roughly 700 kWh, or 8%, below the record set in 2012. Low-carbon electricity generation was about 5,900 kWh per person, around 1,800 kWh, or 23%, below its 2024 record. These gaps are concerning as electrification and AI create additional electricity demand. However, comparison with record years alone does not establish whether consumption increased or decreased from the immediately preceding year.
Suggestions
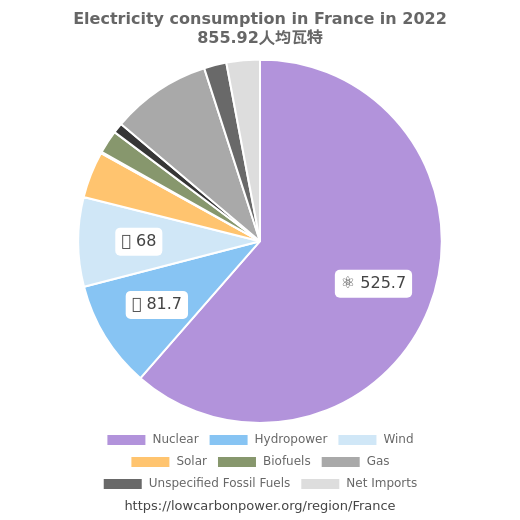
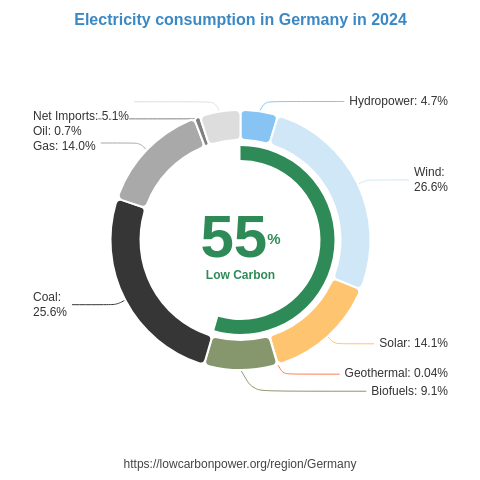
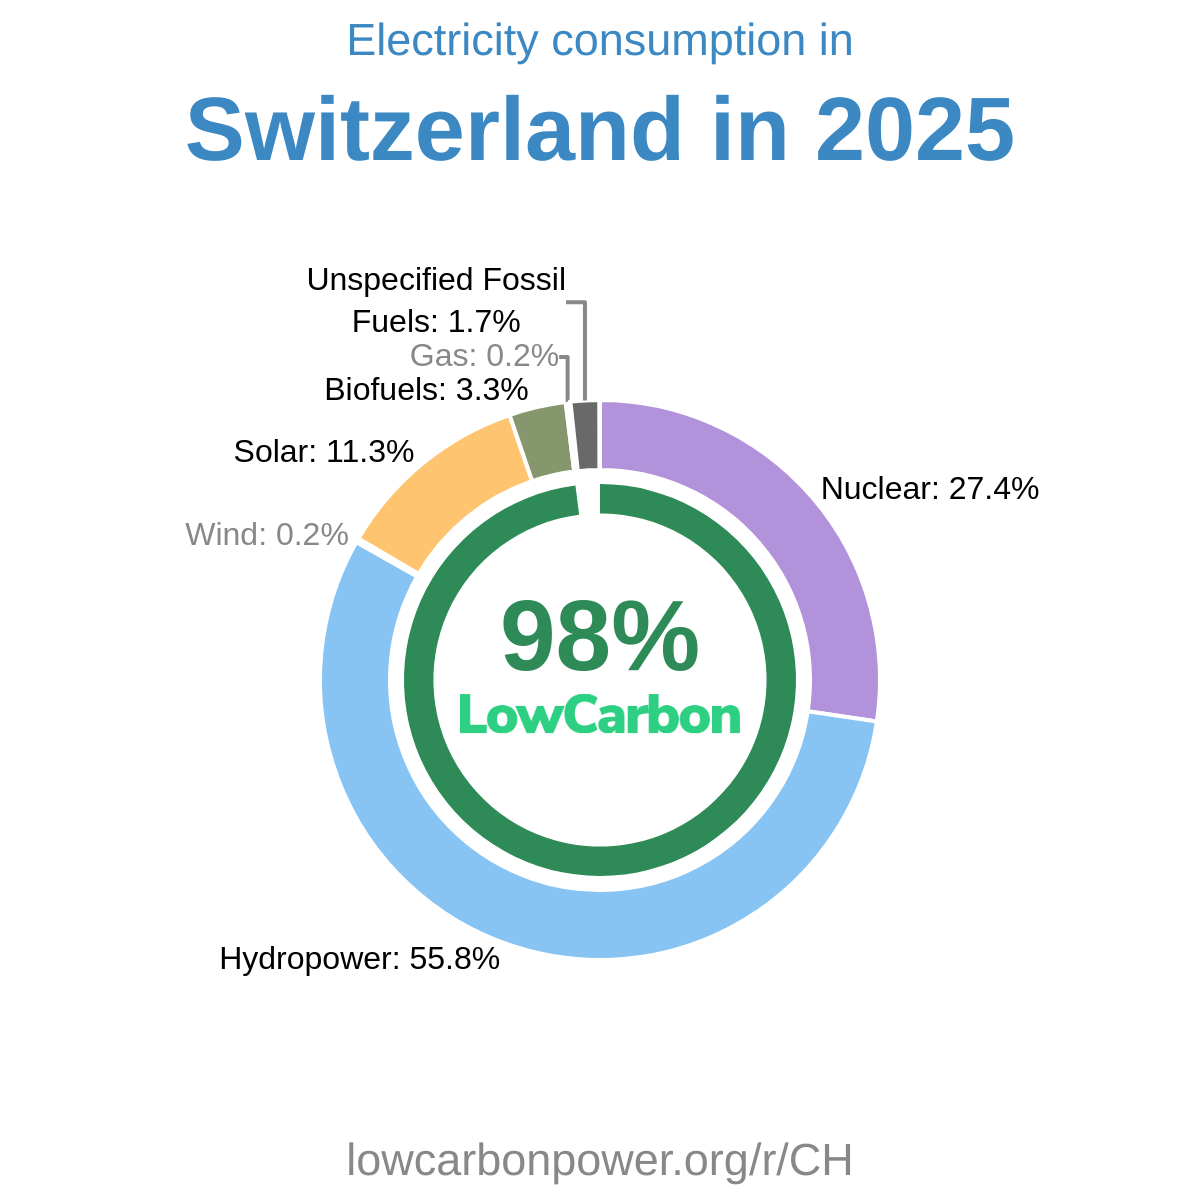
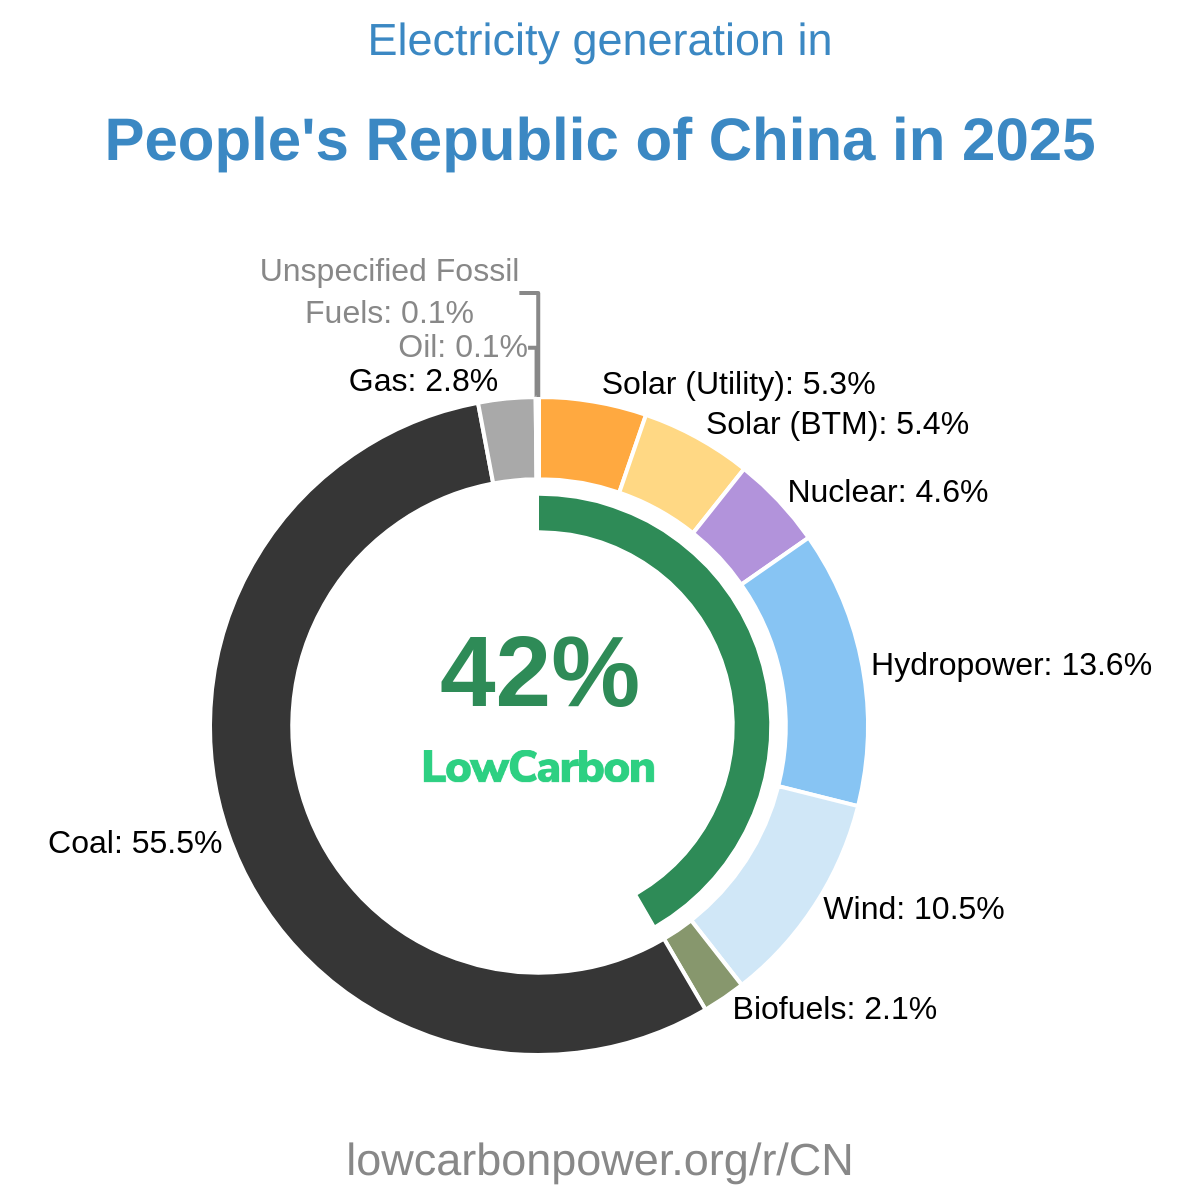
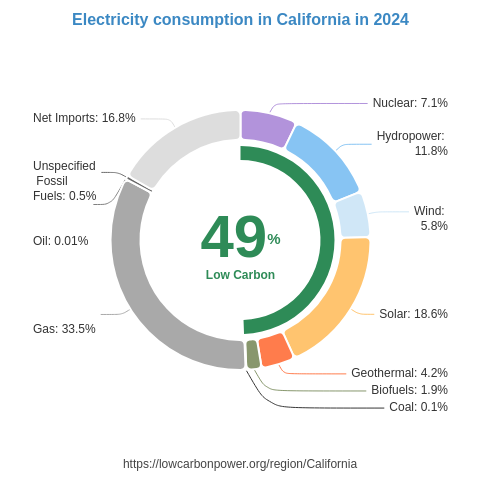
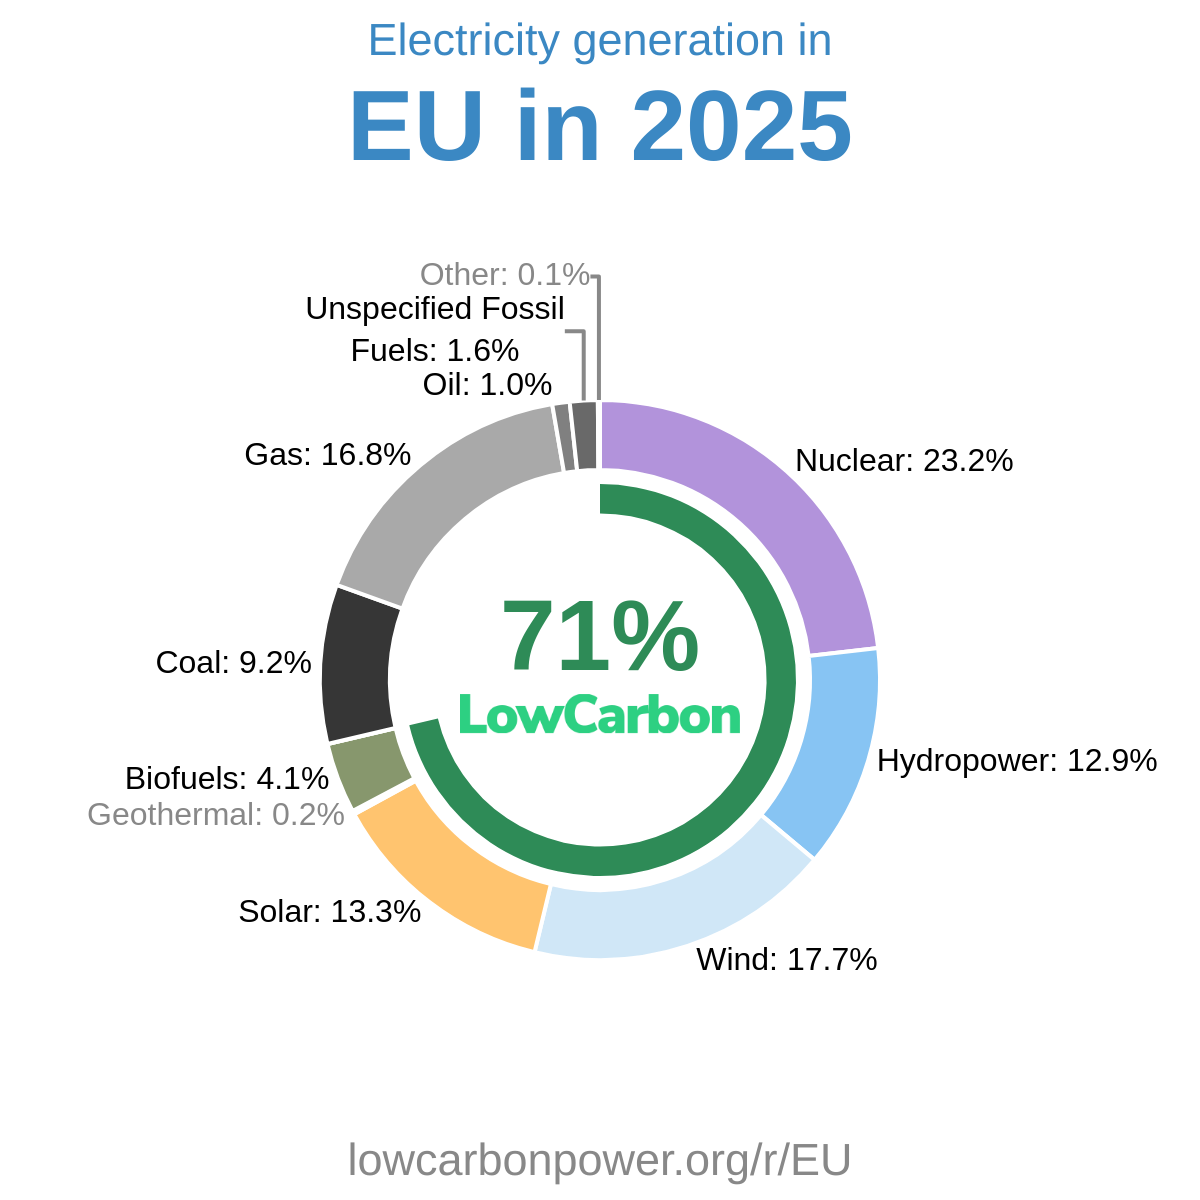
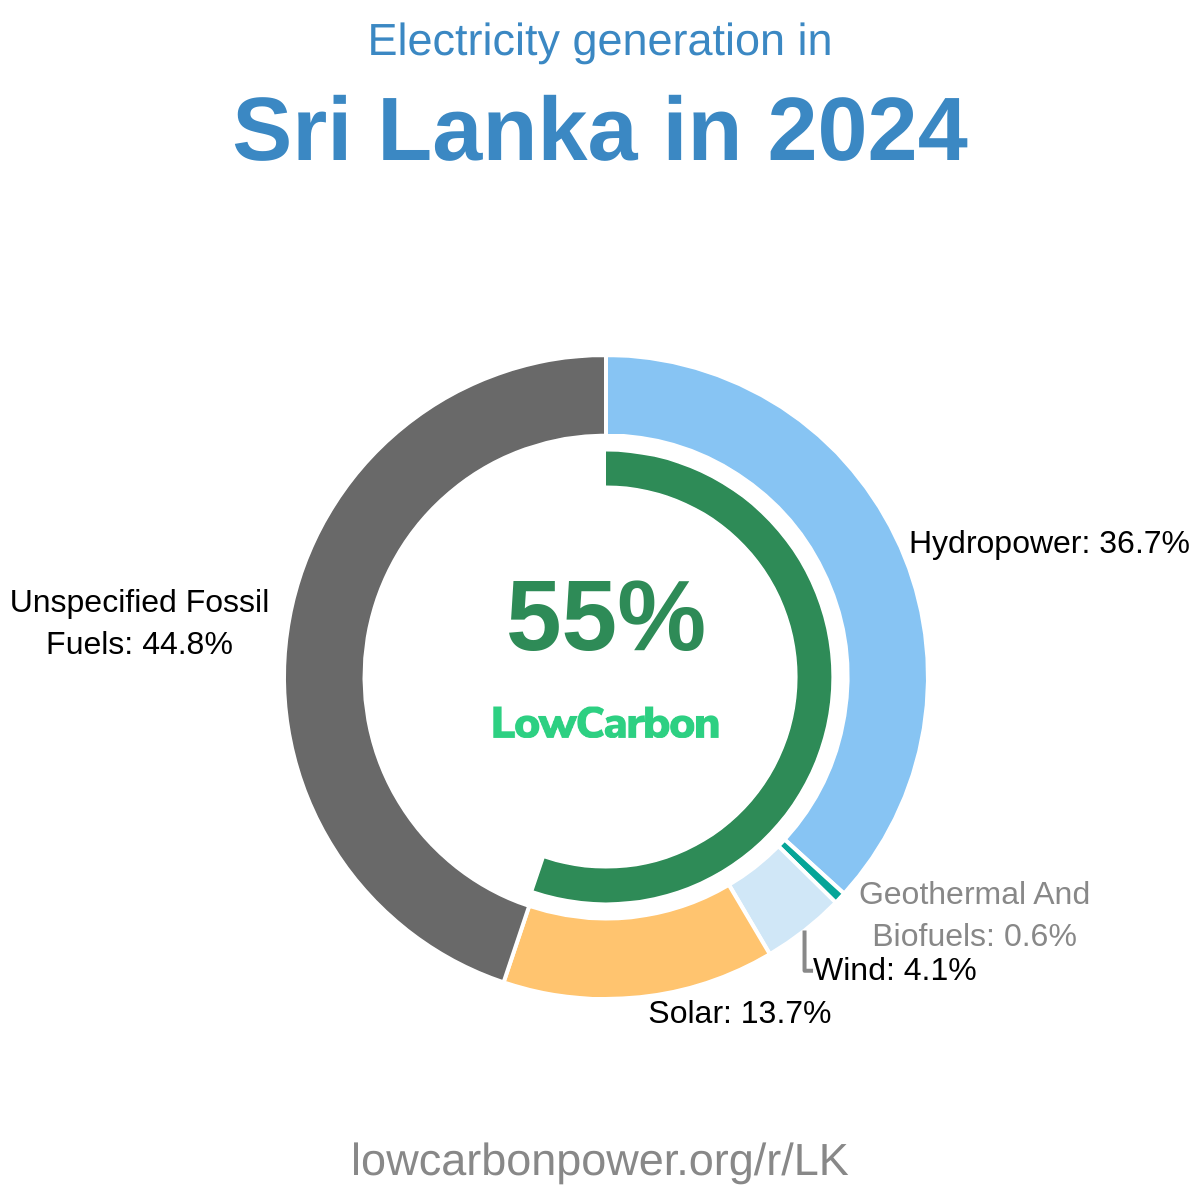
Austria can increase clean electricity generation by expanding solar and wind, both of which already make substantial contributions. Nearby Germany, where wind generates about 31% of electricity, offers a relevant example, while Denmark’s 59% wind share illustrates the potential for further expansion. North Macedonia, with solar supplying 40% of its electricity, provides another useful regional reference. Austria should also consider nuclear generation alongside solar and wind: neighboring Slovakia generates about two-thirds of its electricity from nuclear, while Czechia and Slovenia each generate around 40%. These examples offer practical lessons for building a larger, more diverse low-carbon electricity supply.
* 12M = Last 12 months (Oct 2025 – Sep 2026) — a rolling 12-month period, not a calendar year.
History
Austria’s low-carbon electricity history has been dominated by substantial year-to-year changes in hydropower. During the 1970s, several annual gains of roughly 3–5 TWh were interrupted by a 3.5 TWh decline in 1976. Further gains included nearly 5 TWh in 1987 and around 3–4 TWh in both 1992 and 1999. In the 2000s, hydropower fell by almost 7 TWh in 2003 before recovering partly in 2004 and gaining another 3 TWh in 2009. The 2010s brought a remarkable 10 TWh increase in 2012, alongside declines of about 4 TWh in 2011 and 2015. More recently, hydropower rose by 6 TWh in 2023 and nearly 5 TWh in 2024, while solar added over 3 TWh in 2023—an encouraging expansion. Hydropower then fell by 12 TWh in 2025 and another 6 TWh in 2026, underscoring the urgency of expanding Austria’s broader clean electricity supply.
* 12M = Last 12 months (Oct 2025 – Sep 2026) — a rolling 12-month period, not a calendar year.
Electricity Imports and Exports
Balance of Trade
* 12M = Last 12 months (Oct 2025 – Sep 2026) — a rolling 12-month period, not a calendar year.
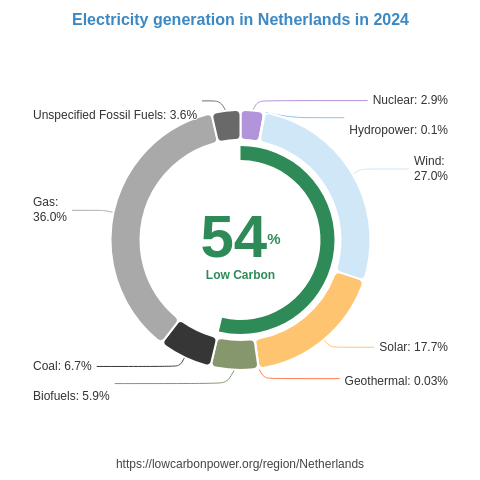
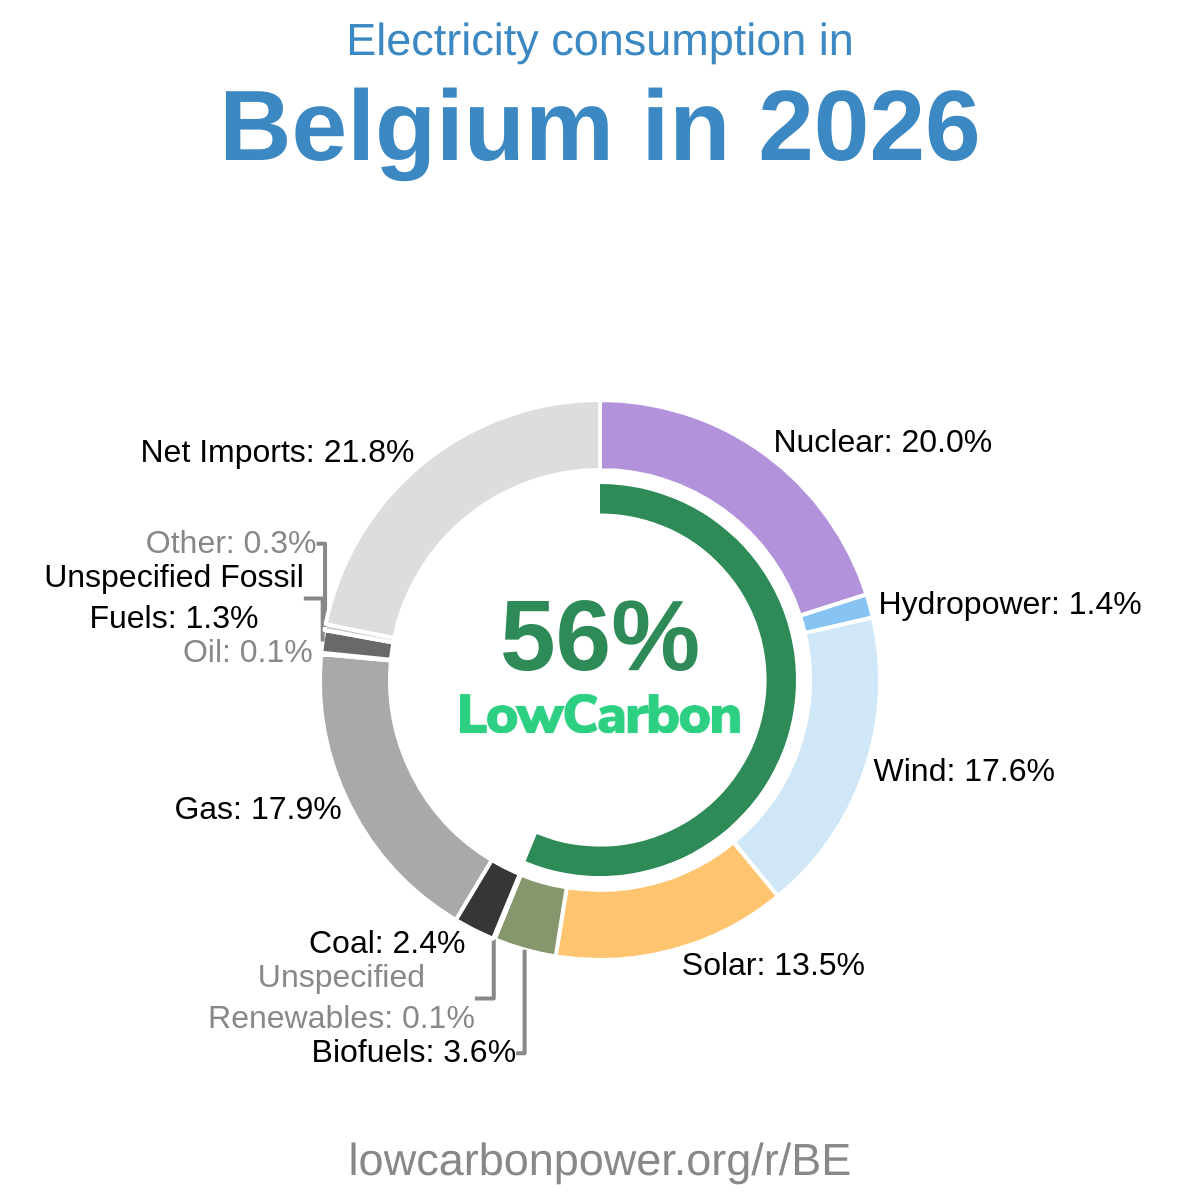
Nearby Regions