Over the past twelve months, from May 2025 to April 2026, the Netherlands has demonstrated a commendable shift towards low-carbon electricity generation. More than half of the country's electricity, approximately 54%, is derived from low-carbon sources such as wind, solar, biofuels, and nuclear power. Wind power accounts for a significant 27% of the total electricity, and solar follows closely with a contribution of around 19%. Biofuels and nuclear energy provide a smaller share, with almost 5% and close to 3%, respectively. Meanwhile, fossil fuels still play a considerable role, contributing nearly 46% to the total electricity generation, with natural gas providing the lion's share at around 36%, followed by coal at about 8%. Although the Netherlands has made progress in clean energy adoption, accelerating the transition from fossil fuels is crucial to minimize negative impacts like climate change and air pollution.
Is Electricity Growing in Netherlands?
Electricity consumption in the Netherlands appears to be in a state of fluctuation rather than rapid growth. The current per capita electricity consumption level is about 7,247 kWh annually, slightly below the record high of 7,435 kWh per person set back in 2008. This indicates a decrease of around 188 kWh per person compared to the past peak, suggesting a somewhat stagnant trend in overall electricity use. However, there is a notable increase on the clean energy front. The per capita generation from low-carbon sources has recently climbed to 3,889 kWh, up from last year’s record of 3,714 kWh, marking an impressive growth of 175 kWh. This positive shift towards cleaner electricity indicates an encouraging trend in adopting sustainable energy practices, even if overall consumption isn't surging yet.
Suggestions
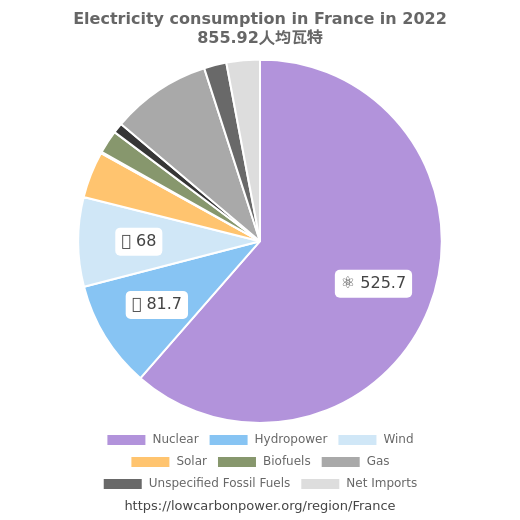
To escalate the transition towards low-carbon electricity generation, the Netherlands should focus on enhancing wind and solar power production. As wind energy already contributes significantly to the electricity mix, further investments and technological advancements in this sector could yield substantial benefits. Similarly, solar power holds untapped potential that can be unlocked by adopting innovative deployment techniques and fostering public-private partnerships. The Dutch can draw inspiration from Denmark, where a remarkable 60% of electricity comes from wind, showcasing the potential for significant wind energy integration. Furthermore, boosting nuclear energy generation could be instrumental in the Netherlands' clean energy portfolio, as evidenced by France's achievement, where nuclear accounts for about 67% of electricity generation. By expanding nuclear capacity alongside solar energy deployment, the Netherlands could enhance its energy security, reduce fossil fuel dependency, and continue to position itself as a leader in sustainable electricity.
* 12M = Last 12 months (May 2025 – Apr 2026) — a rolling 12-month period, not a calendar year.
History
The history of low-carbon electricity generation in the Netherlands reflects a series of progressive steps, with the past few decades witnessing substantial gains in wind and solar power. In recent years, especially from 2015 onward, there has been noticeable growth in wind energy, which increased by almost 2 TWh in 2015 and further surged in the subsequent years, including a remarkable 8 TWh in 2023. Solar power has also seen robust growth, particularly between 2020 and 2023, with annual additions each year and a significant rise of over 6 TWh in 2022 alone. Although there was a setback in nuclear energy back in 1997, with a decrease of 1.8 TWh, the steady gains in wind and solar energy compensate for this decline, showcasing the country's commitment to expanding its low-carbon infrastructure. Supportive policies and strategic investments in these clean energy sources can help the Netherlands continue this positive trajectory and contribute to global efforts against climate change.
* 12M = Last 12 months (May 2025 – Apr 2026) — a rolling 12-month period, not a calendar year.
Electricity Imports and Exports
Balance of Trade
* 12M = Last 12 months (May 2025 – Apr 2026) — a rolling 12-month period, not a calendar year.
Nearby Regions