Electricity in Massachusetts in 2025/2026
From July 2025 through June 2026, Massachusetts relied on net electricity imports for more than half of its consumption—about 57%. In-state fossil-fuel generation supplied around 27%, overwhelmingly from gas at 26%, with oil contributing about 1%. In-state low-carbon generation supplied roughly 14%, led by solar at about 11% of consumption: around 7% from behind-the-meter systems and 4% from utility-scale installations. Biofuels and wind each contributed about 1%. The data do not identify the generation sources behind imported electricity, so imports cannot be classified here as either clean or fossil-based.
Is Electricity Growing in Massachusetts?
Electricity consumption per person is growing modestly in Massachusetts. The latest 2026 figure reached about 8,600 kWh per person, exceeding the previous record of roughly 8,500 kWh in 2025 by 97 kWh, or just over 1%. Low-carbon electricity generation grew faster, reaching 1,230 kWh per person—86 kWh above the 2025 record of 1,144 kWh, an increase of about 8%. These new records are encouraging, particularly the stronger growth in clean electricity, but sustained expansion will be important as electrification and AI increase electricity demand.
Suggestions
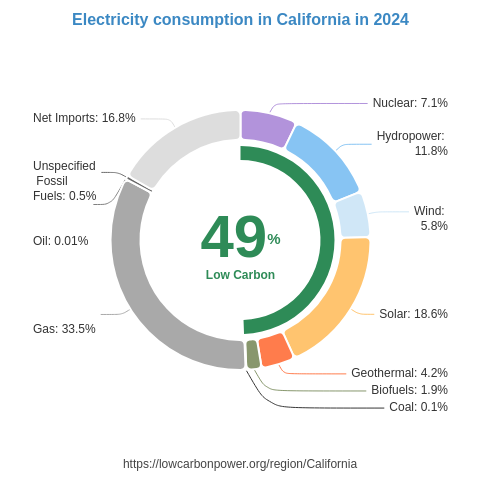
Massachusetts should build on solar’s existing contribution by expanding rooftop, commercial, and utility-scale installations. The US states of California and Nevada, where solar supplies about 31% and 35% of electricity generation respectively, offer useful examples of deployment at scale, although local conditions differ. Nearby nuclear leaders are especially relevant: nuclear supplies more than half of electricity generation in the US state of New Hampshire and over a third in the US state of Connecticut. Massachusetts should consider developing nuclear generation alongside solar to substantially increase its clean electricity supply. Wind can also contribute, with the neighboring US state of Maine generating about 18% of its electricity from wind. Together, these technologies can support growing electricity demand while reducing reliance on fossil fuels and their associated climate impacts and air pollution.
* 12M = Last 12 months (Jul 2025 – Jun 2026) — a rolling 12-month period, not a calendar year.
History
The supplied history covers 2024 through 2026 and shows uneven progress across the listed low-carbon sources. In 2024 and 2025, wind generation was unchanged, while hydropower fell by 0.4 TWh in 2024 before remaining steady in 2025. Biofuel generation was unchanged in 2024 and then fell by 0.1 TWh in 2025. In 2026, wind delivered an encouraging increase of 0.4 TWh, while hydropower decreased by 0.1 TWh and biofuels remained unchanged. The recent wind gain is a welcome step toward greater clean electricity production; however, these figures exclude changes in solar and nuclear generation and therefore do not provide a complete history of Massachusetts’s low-carbon electricity supply.
* 12M = Last 12 months (Jul 2025 – Jun 2026) — a rolling 12-month period, not a calendar year.
Electricity Imports and Exports
Balance of Trade
* 12M = Last 12 months (Jul 2025 – Jun 2026) — a rolling 12-month period, not a calendar year.
Nearby Regions


.png)