From July 2025 through June 2026, fossil fuels supplied about 80% of Mississippi’s electricity consumption, while low-carbon sources supplied about 20%. Gas dominated at roughly 76%, with coal contributing another 4.5%. Nuclear was the largest clean electricity source, accounting for about 13%, followed by solar at just over 4%, almost entirely from utility-scale installations. Biofuels supplied nearly 2%. This leaves Mississippi heavily dependent on fossil electricity, with considerable room to expand clean generation and reduce the climate and air-pollution impacts of fossil fuels.
Is Electricity Growing in Mississippi?
Electricity consumption per person is not currently growing in Mississippi. The latest 2026 figure was about 26,400 kWh per person, roughly 230 kWh—or 0.9%—below the record set in 2025. Low-carbon electricity generation also fell short of its previous peak: about 5,230 kWh per person, compared with roughly 5,530 in 2025, a decline of about 5%. These setbacks are concerning when more clean electricity is needed to support electrification and growing demand from AI and other industries. These per-person figures, however, do not establish whether statewide electricity consumption increased or decreased.
Suggestions
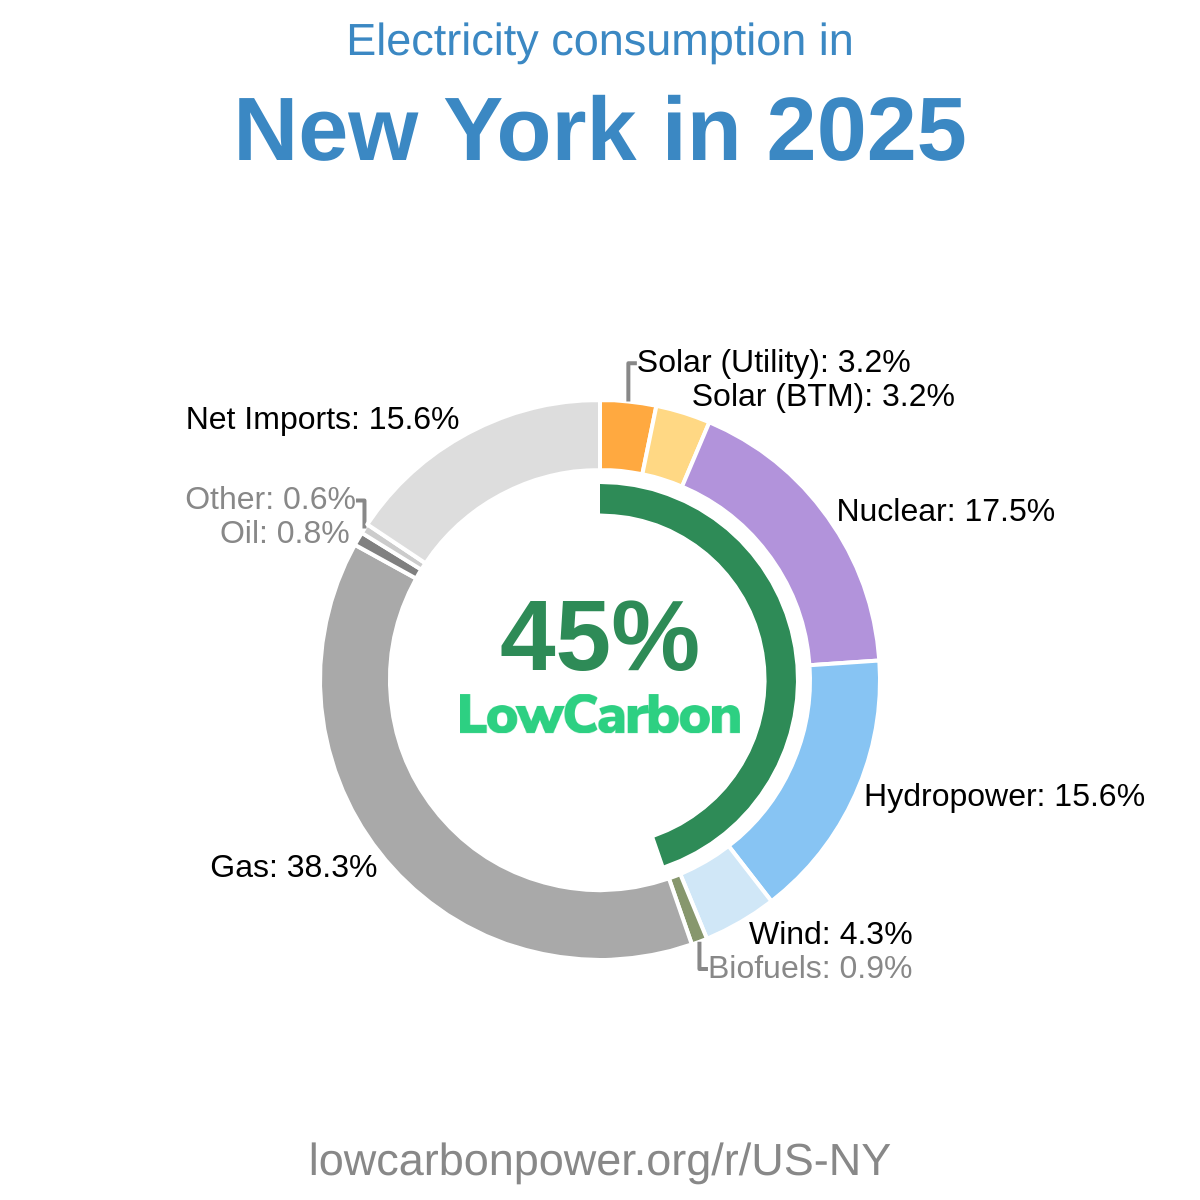
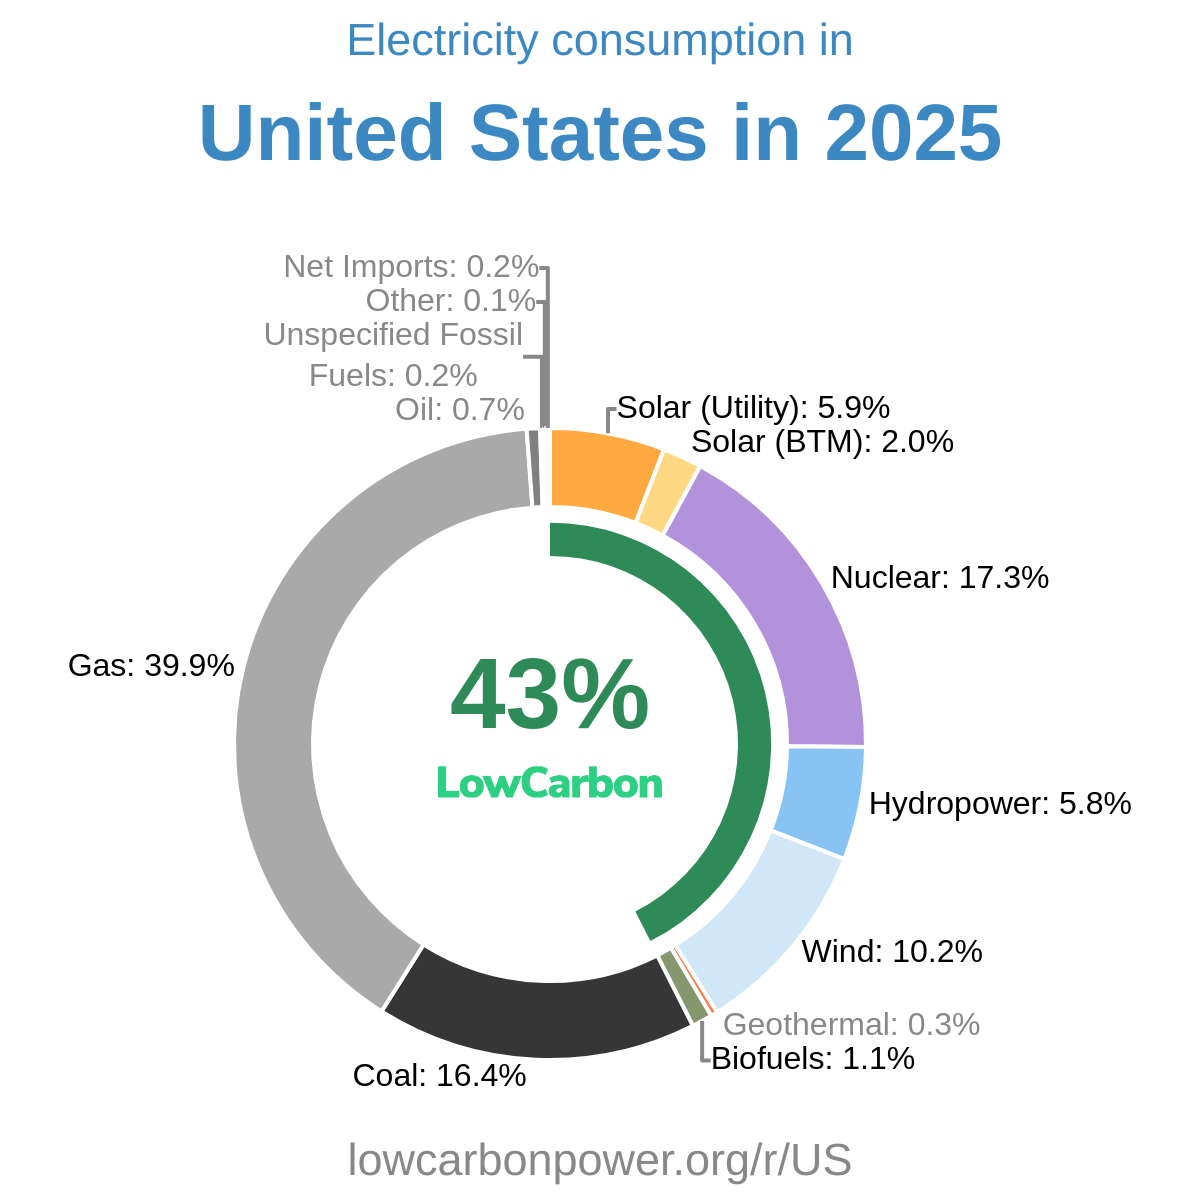
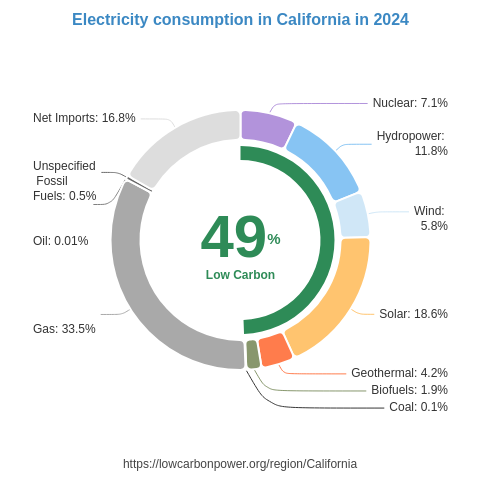
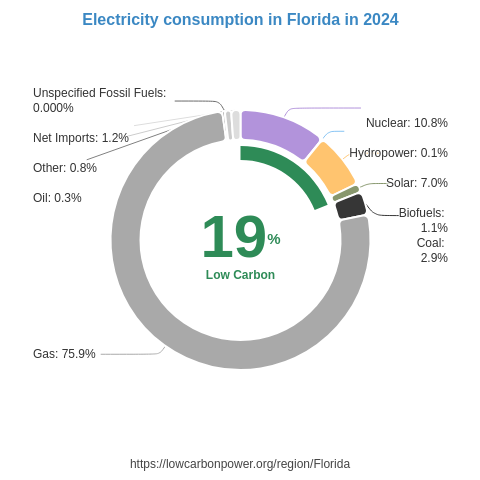
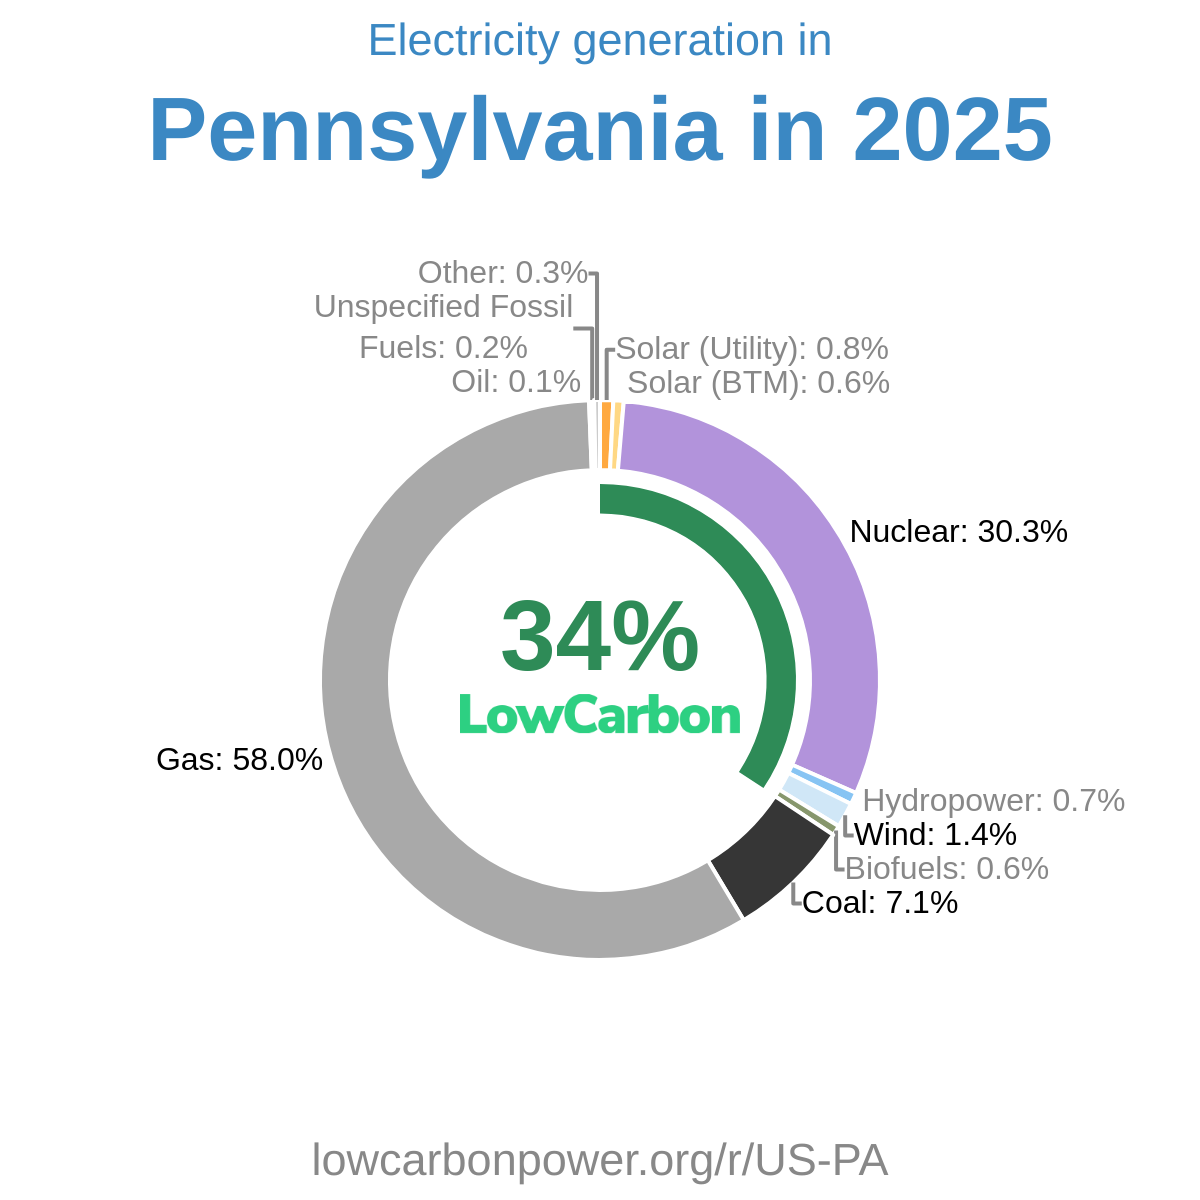
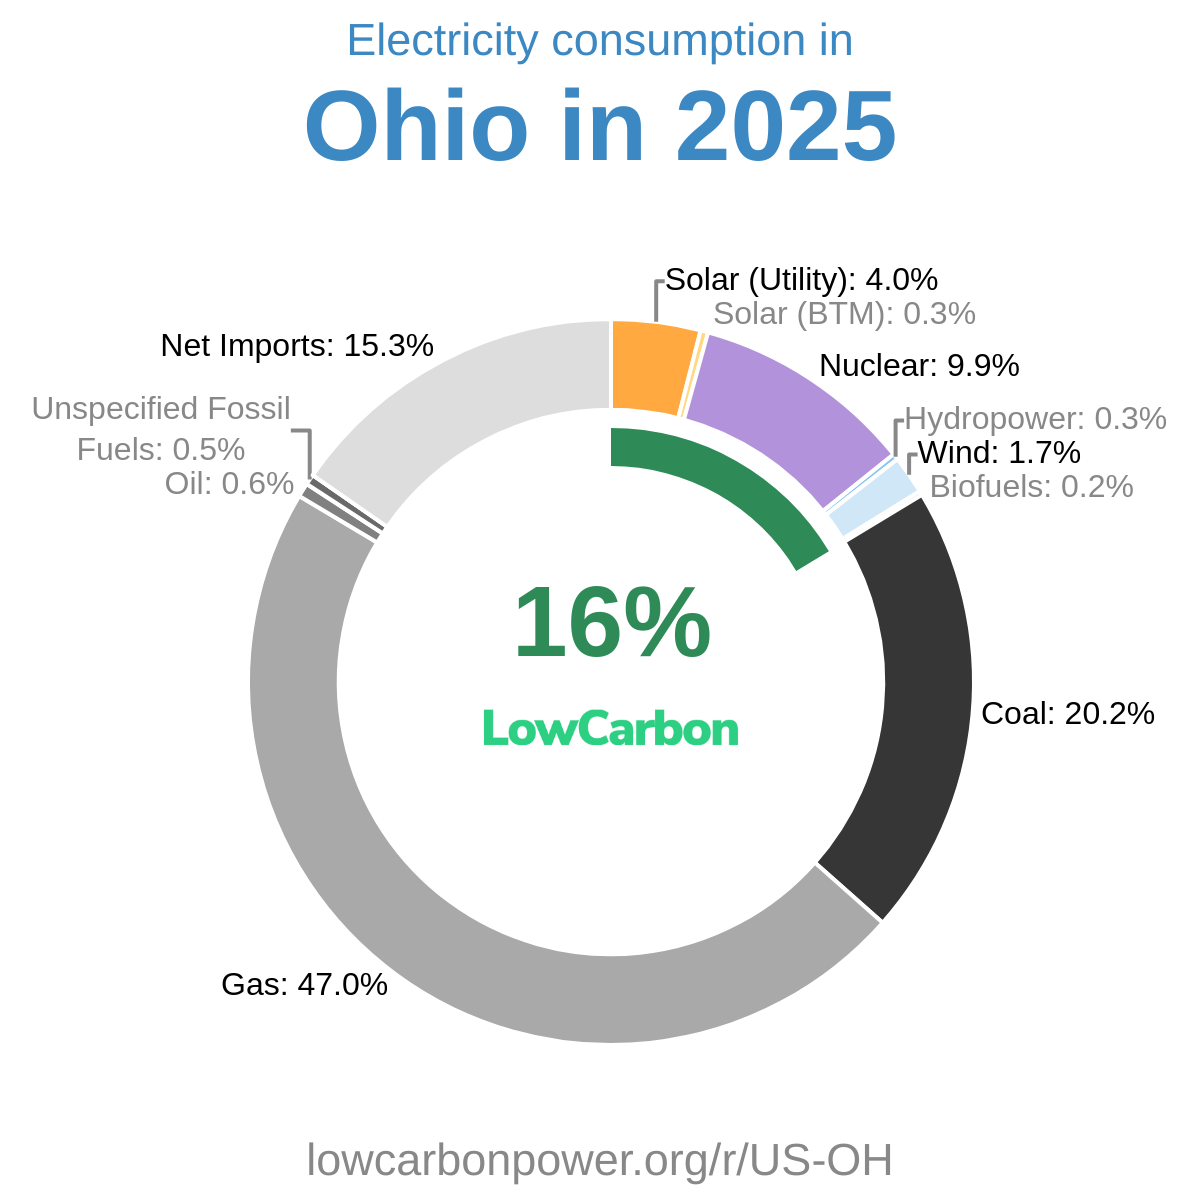
Mississippi should prioritize expanding its existing nuclear generation, already its largest low-carbon electricity source, alongside a substantial solar buildout. Nearby regions offer useful examples: the US states of Alabama and Georgia each generate about 30% of their electricity from nuclear, Tennessee about 32%, and South Carolina more than half. Mississippi can learn from their experience in sustaining and expanding nuclear electricity production. For solar, the US states of Nevada and California demonstrate the scale achievable, generating about 35% and 31% of their electricity from solar, respectively. Wind could also complement these sources where local conditions are suitable; the US states of Texas and Oklahoma generate about 22% and 45% of their electricity from wind.
* 12M = Last 12 months (Jul 2025 – Jun 2026) — a rolling 12-month period, not a calendar year.
History
The supplied history covers 2024 through 2026 and shows an uneven trajectory for Mississippi’s low-carbon electricity. Nuclear generation fell by 1.1 TWh in 2024, recovered by 0.8 TWh in 2025, and then fell by 1.3 TWh in 2026. The recovery was welcome, but the subsequent setback underscores the importance of sustaining and expanding this major clean electricity source. Wind added 0.2 TWh in 2025 and recorded no further change in 2026. Biofuel generation declined by 0.1 TWh in 2024 and remained unchanged in both subsequent years. Together, these changes highlight the need for stronger, more consistent growth in nuclear and solar electricity.
* 12M = Last 12 months (Jul 2025 – Jun 2026) — a rolling 12-month period, not a calendar year.
Electricity Imports and Exports
Balance of Trade
* 12M = Last 12 months (Jul 2025 – Jun 2026) — a rolling 12-month period, not a calendar year.
Nearby Regions


.png)