In Indonesia's electricity sector in 2023, fossil fuels dominate the landscape with more than four-fifths of the electricity being generated from fossil sources. Coal is the primary contributor, accounting for almost two-thirds of the total electricity generation, with gas contributing about a sixth and oil making up a small fraction of the energy mix. On the other hand, low-carbon electricity sources, which are crucial for reducing carbon emissions, make up a little less than a fifth of the electricity production. Among these, hydropower leads with approximately 7% of the contribution, followed by biofuels at 6.4%, and geothermal at almost 5%. The high reliance on fossil fuels poses significant environmental challenges, including air pollution and climate change, making it imperative for Indonesia to transition to cleaner energy sources.
Is Electricity Growing in Indonesia?
Electricity consumption in Indonesia is on the rise, as demonstrated by the increase in per capita consumption from 1199 kWh in 2022 to 1250 kWh in 2023. This upward trend reflects growing demand, likely driven by factors such as industrial expansion and increased electrification. However, while overall electricity consumption has increased, low-carbon electricity generation has seen a slight decline, with a per capita generation dropping from 235 kWh in 2022 to 232 kWh in 2023. This stagnation is concerning because it hampers progress towards reducing carbon emissions and enhancing energy security through diversified energy sources.
Suggestions
Indonesia can gain insights from regions that have successfully increased their low-carbon electricity generation by focusing on solar, wind, and nuclear energy. Examples from around the world include California and Nevada, where solar energy accounts for around a third of electricity generation, offering a model for similar sunny climates in Indonesia. Additionally, nuclear energy, which is a vital part of the energy mix in countries like France and Slovakia, generating up to 67% and 65% respectively, could provide Indonesia with a reliable and clean energy source. By adopting these strategies, Indonesia can accelerate its transition to a more sustainable and dependable electricity system, reducing its dependence on fossil fuels and fostering significant environmental benefits.
History
Historically, Indonesia has seen varied developments in low-carbon electricity production. The late 20th and early 21st centuries showed fluctuations in hydropower contributions, with notable increases in 1986 and 1992, followed by some declines in 1994 and 1997. The first two decades of the 21st century featured substantial growth in both geothermal and biofuels. The period also saw significant hydropower increases in 2010, 2013, and 2020, complemented by growth in biofuels in 2018 and again between 2021 and 2022. Unfortunately, recent years have also seen some setbacks, such as in hydropower in 2023. Navigating these fluctuations and focusing on more stable clean energy options like solar and nuclear can help provide more consistent growth in Indonesia's low-carbon energy portfolio.
Electricity Imports and Exports
Balance of Trade
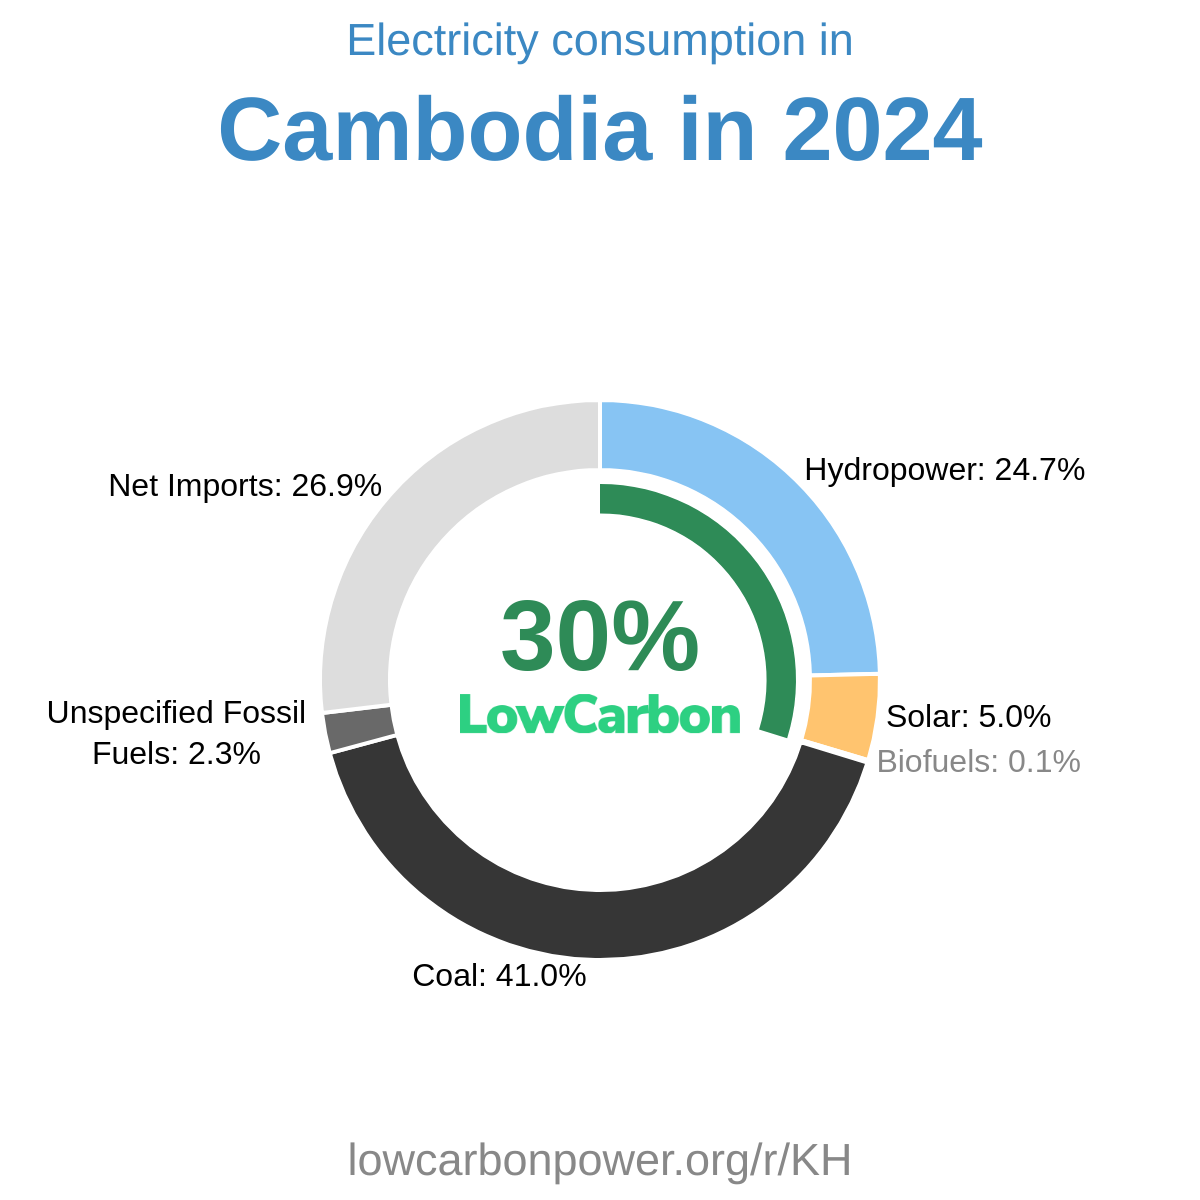
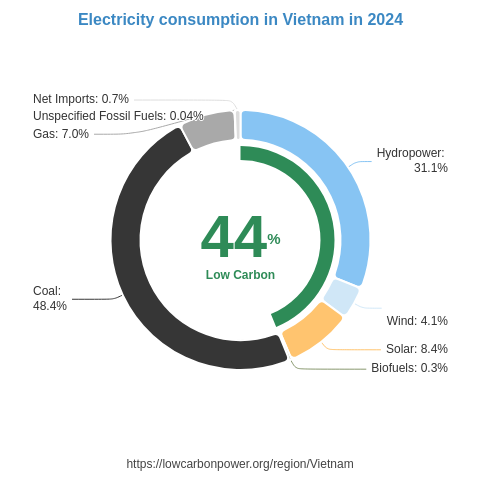
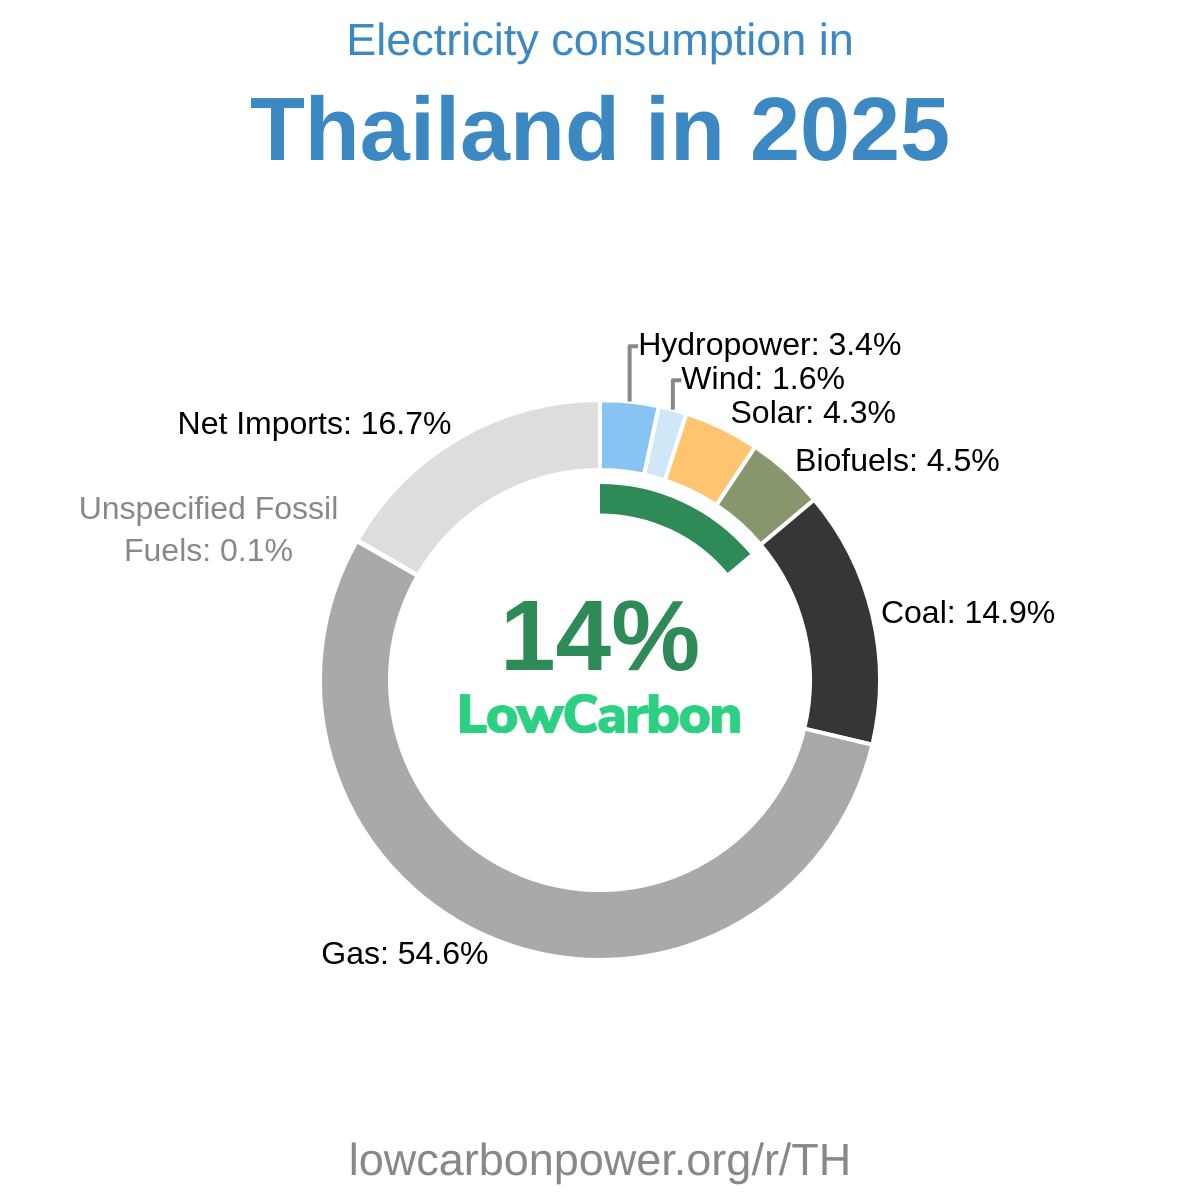
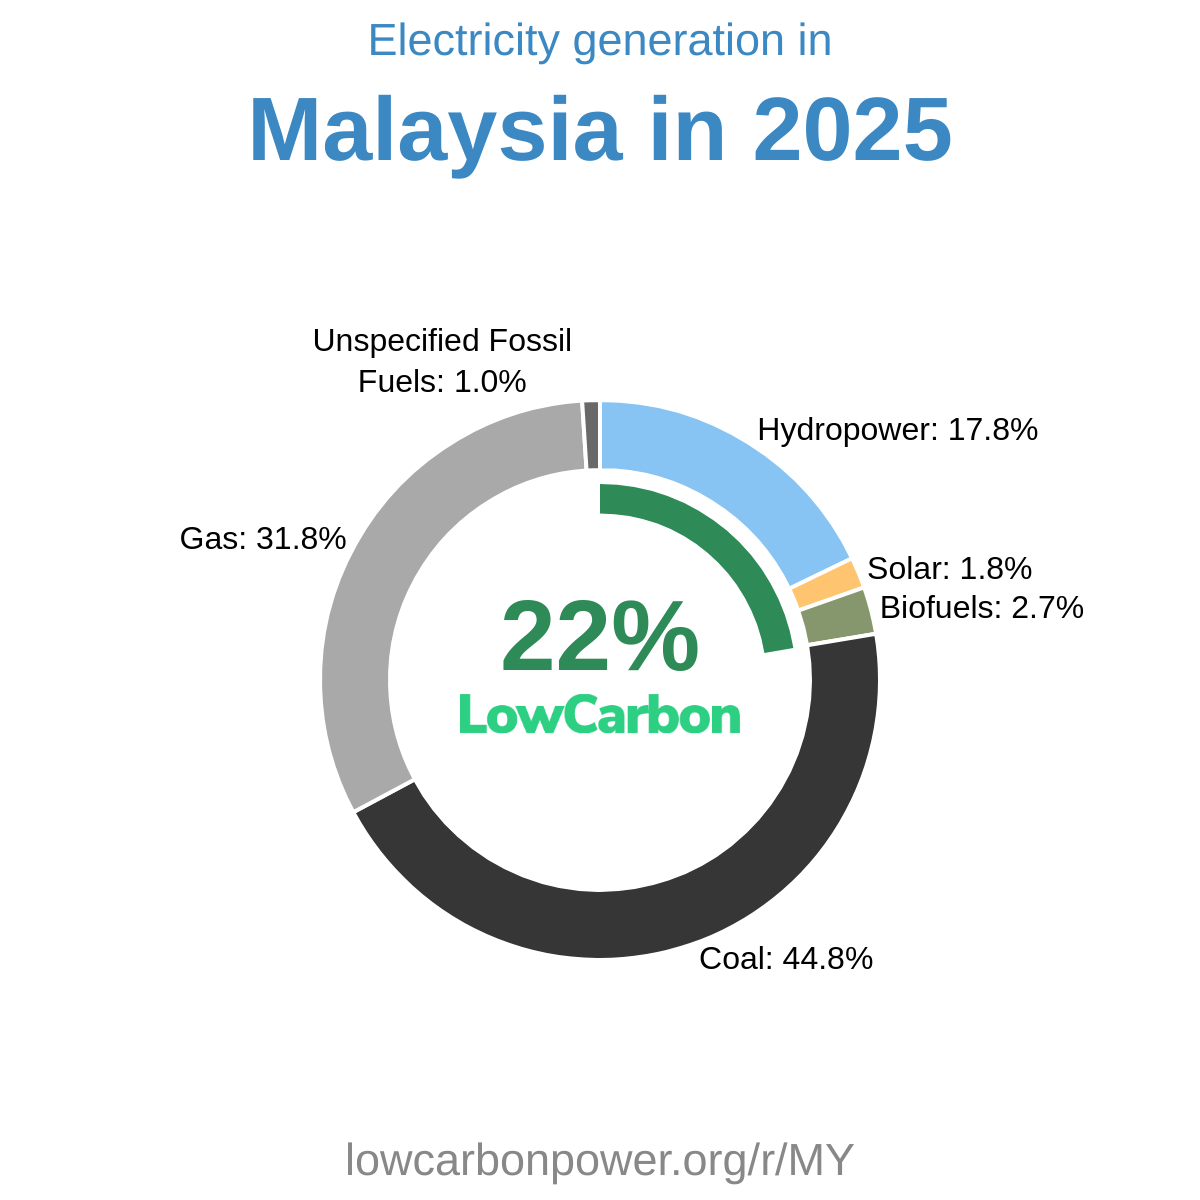
Nearby Regions
.png)