

From July 2025 through June 2026, low-carbon sources accounted for about 62% of Maine’s electricity consumption, while fossil fuels supplied about 37%. Solar led the clean electricity mix at roughly 18%, closely followed by wind at 18%, hydropower at 15%, and biofuels at 10%. Solar’s contribution was split between utility-scale installations, at about 10% of electricity consumption, and behind-the-meter systems, such as rooftop panels, at about 9%. Gas dominated fossil electricity at roughly 35% of consumption, while oil contributed about 2%. Maine therefore gets well over half its electricity from low-carbon sources, but still has considerable scope to replace fossil electricity and reduce climate-changing emissions and air pollution.
Is Electricity Growing in Maine?
Electricity consumption in Maine is growing: the latest 2026 figure reached about 11,750 kWh per person, exceeding the previous record of about 11,400 kWh in 2025 by 344 kWh, or roughly 3%. Low-carbon electricity generation also reached a new high of about 7,240 kWh per person, up by around 90 kWh, or just over 1%, from its 2025 record. These records are encouraging, although clean generation per person grew more slowly than overall electricity consumption. Accelerating low-carbon electricity growth would help Maine meet rising demand from electrification and AI while reducing dependence on fossil fuels.
Suggestions
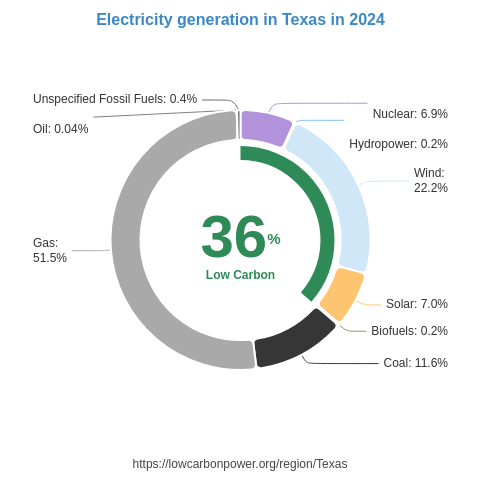
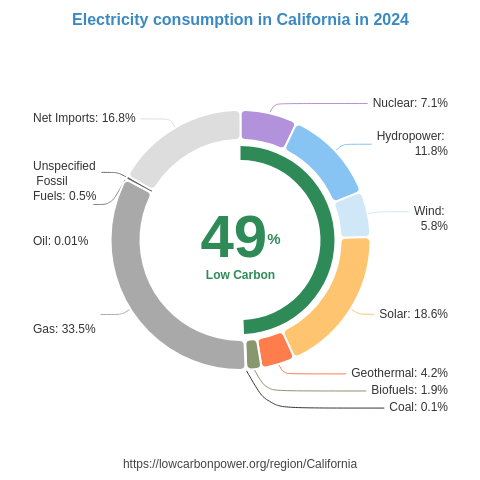
Maine should expand its already substantial wind and solar generation while considering nuclear power as another source of clean electricity. For wind, useful examples include Denmark, where wind supplies 59% of electricity, and the US state of Iowa, where it supplies 57%. For solar, Maine can study deployment approaches in the US states of California and Nevada, where solar generates about 31% and 35% of electricity, respectively, adapting those lessons to local conditions. Nearby nuclear examples are especially relevant: nuclear supplies 52% of electricity in the US state of New Hampshire and 36% in the US state of Connecticut. Together, these regions demonstrate how expanded wind and solar, alongside nuclear generation, can support a much larger low-carbon electricity supply.
* 12M = Last 12 months (Jul 2025 – Jun 2026) — a rolling 12-month period, not a calendar year.
History
The supplied history for 2024–2026 shows steady wind growth alongside declining hydropower output. Wind generation increased by 0.1 TWh in 2024, 0.4 TWh in 2025, and another 0.1 TWh in 2026—a combined gain of 0.6 TWh. Hydropower, however, fell by 1 TWh in 2024, followed by further decreases of 0.2 TWh in 2025 and 0.1 TWh in 2026. Biofuel generation rose by 0.2 TWh in 2024 and 0.1 TWh in 2025 before remaining unchanged in 2026. Across these listed sources, the gains did not fully offset the hydropower declines, leaving a net decrease of about 0.4 TWh over the three years. That disappointing result reinforces the importance of accelerating clean electricity expansion.
* 12M = Last 12 months (Jul 2025 – Jun 2026) — a rolling 12-month period, not a calendar year.
Electricity Imports and Exports
Balance of Trade
* 12M = Last 12 months (Jul 2025 – Jun 2026) — a rolling 12-month period, not a calendar year.
Nearby Regions