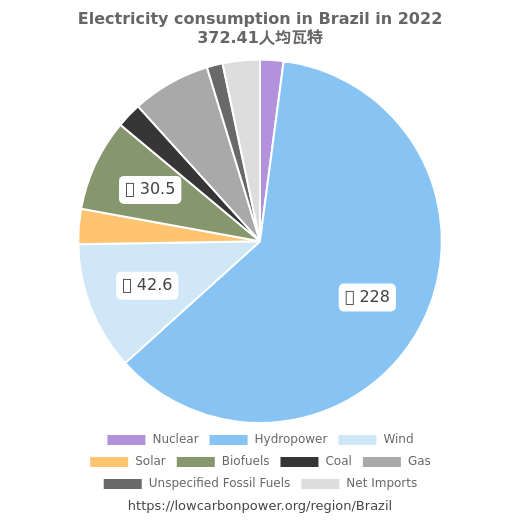
The current electricity consumption in Suriname is primarily powered by fossil energy, which accounts for a little over half of the electricity generation, about 57%. The remaining share, nearly 43%, is generated from low-carbon sources, with hydropower being the only low-carbon provider at approximately 42%. This means that Suriname relies almost exclusively on hydropower for its clean energy and has little to no diversity in its low-carbon electricity sources. This lack of diversification could pose challenges in sustainability and energy security, as a single source is vulnerable to variations in natural conditions such as rainfall.
Is Electricity Growing in Suriname?
Electricity consumption in Suriname currently stands at 3,403 kWh per person, which marks a decline from its peak of 4,293 kWh per person in 1993. This indicates a drop of 890 kWh per person. Similarly, low-carbon electricity generation has also decreased, with the current figure being 1,463 kWh per person compared to a previous record of 3,577 kWh per person in 1993, a decline of 2,114 kWh per person. These reductions suggest that there has been a significant decline in both overall electricity consumption and the share of low-carbon electricity in Suriname over the past decades, highlighting the need for a strategic shift to enhance the country's energy landscape.
Suggestions
To increase low-carbon electricity generation and move towards a more sustainable energy future, Suriname could expand into other low-carbon technologies such as solar and nuclear energy. Regions like Nevada and California have made great strides in solar energy, achieving around 31-34% of their electricity, which could serve as a valuable example for Suriname. Additionally, countries and states like France and New Hampshire, where nuclear electricity accounts for a substantial portion of the energy mix, can offer insights into successfully integrating nuclear power. By learning from these examples, Suriname can diversify its clean energy portfolio, reduce dependence on fossil fuels, and work towards reducing its carbon footprint and combating climate change.
History
Historically, Suriname’s low-carbon electricity generation, primarily through hydropower, has faced fluctuations. In the early 1980s, the output varied slightly, with smaller changes followed by a notable increase in 1989. The 1990s and 2000s demonstrated a pattern of small reductions, capturing an era of inconsistency. More recently, the 2010s showed minor increases and decreases, with a positive bump in 2016. While the variations are solely related to hydropower, this historical data emphasizes the need for more stable and diverse low-carbon energy sources so that the country can better cope with changing environmental conditions and ensure consistent energy availability.
Electricity Imports and Exports
Balance of Trade
Nearby Regions