

From July 2025 through June 2026, Oklahoma’s electricity consumption was split almost evenly between fossil fuels, at about 51%, and low-carbon sources, at about 49%. Wind supplied roughly 45% of electricity, making it the largest individual source, ahead of gas at 43%. Coal contributed about 8%, while solar and hydropower each supplied nearly 2%. Utility-scale solar accounted for about 1.4% of the total, included within solar’s overall share. Oklahoma therefore has a substantial clean electricity foundation, but fossil fuels still supply slightly more than half its electricity, contributing to climate change and air pollution.
Is Electricity Growing in Oklahoma?
Oklahoma’s latest figures show strong growth in low-carbon electricity, but total electricity consumption remains below its historical peak. Consumption in 2026 was about 22,600 kWh per person, roughly 440 kWh, or 2%, below the 2024 record of about 23,000 kWh per person. That shortfall is concerning as electrification and AI create additional electricity demand. Encouragingly, low-carbon electricity generation reached a new record of about 11,100 kWh per person, around 1,100 kWh, or 11%, above the previous record set in 2025. Clean generation is advancing even though overall consumption has not regained its peak.
Suggestions
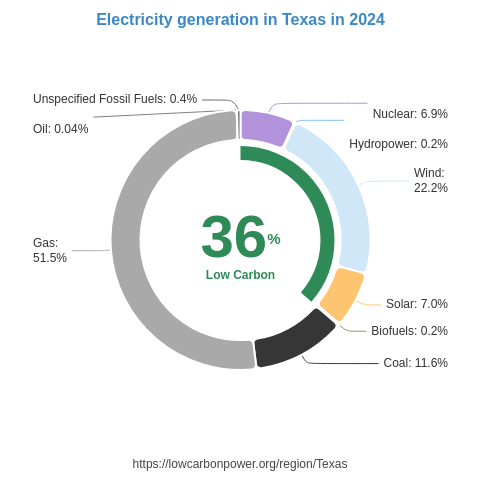
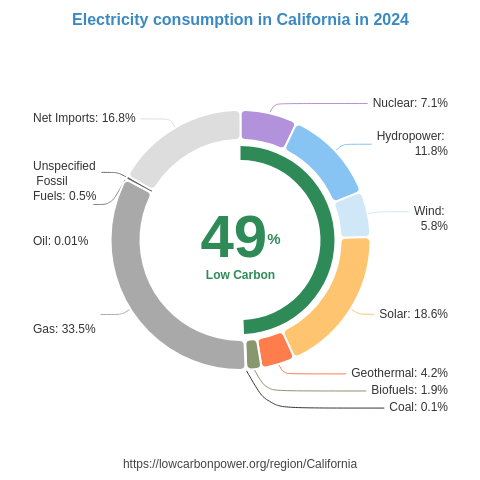
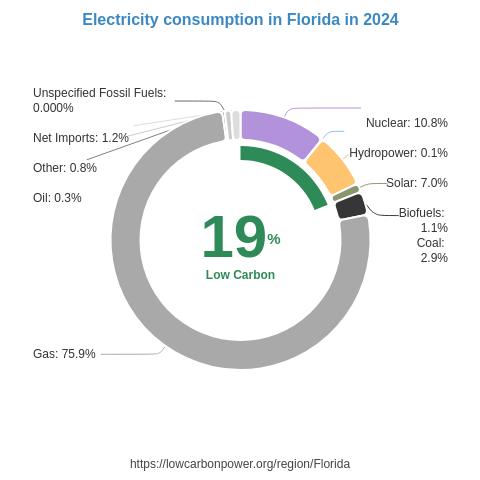
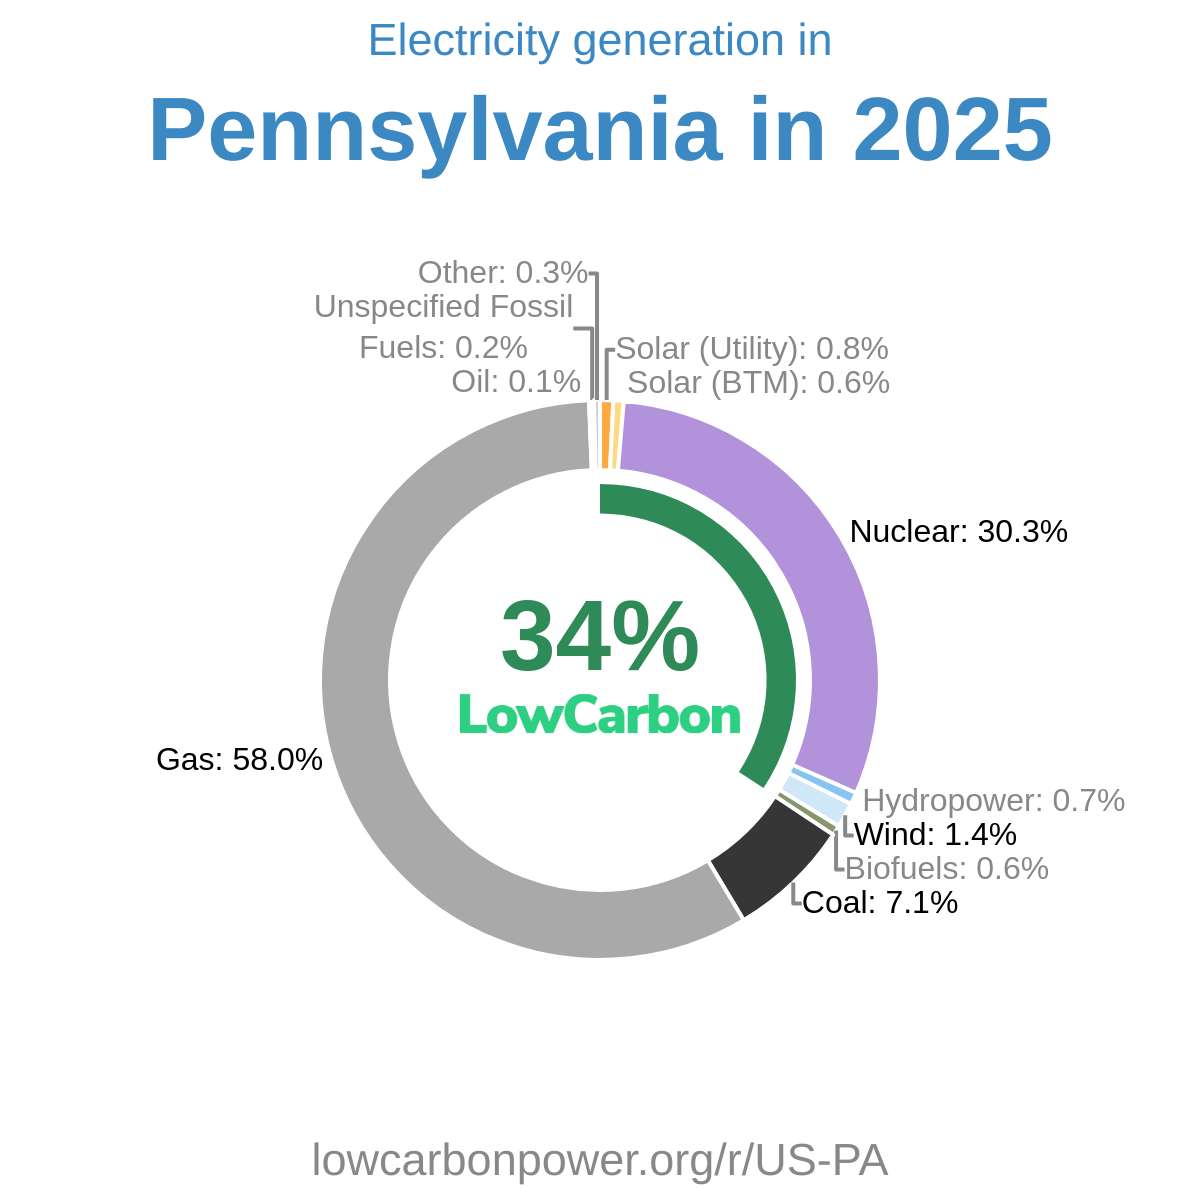
Oklahoma should build on its successful wind sector while expanding solar and considering new nuclear generation. The US states of Iowa and South Dakota demonstrate the potential for even higher wind contributions, generating about 57% and 56% of their electricity from wind, respectively. Nearby solar examples are also useful: the US states of Texas and New Mexico generate about 12% and 18% of their electricity from solar, compared with Oklahoma’s roughly 2%. Nuclear could further strengthen Oklahoma’s low-carbon electricity supply, drawing lessons from neighboring US states such as Kansas and Arkansas, where nuclear supplies about 15% and 21% of electricity, respectively. Expanding these clean sources alongside transmission infrastructure would support rising electricity demand and reduce reliance on fossil fuels.
* 12M = Last 12 months (Jul 2025 – Jun 2026) — a rolling 12-month period, not a calendar year.
History
The available history shows that wind has driven Oklahoma’s recent low-carbon electricity gains. In 2024 and 2025, wind generation increased by a combined 1.1 TWh, while hydropower added 0.3 TWh and biofuels added 0.1 TWh. Growth accelerated sharply in 2026, when wind generation rose by another 4.2 TWh—a particularly encouraging increase. Hydropower slipped by 0.1 TWh that year, while biofuels generation remained unchanged in both 2025 and 2026. Across these three years, the listed sources added about 5.6 TWh of low-carbon electricity generation, overwhelmingly thanks to wind.
* 12M = Last 12 months (Jul 2025 – Jun 2026) — a rolling 12-month period, not a calendar year.
Electricity Imports and Exports
Balance of Trade
* 12M = Last 12 months (Jul 2025 – Jun 2026) — a rolling 12-month period, not a calendar year.
Nearby Regions