

From July 2025 through June 2026, Nebraska’s electricity consumption was supplied in almost equal measure by fossil fuels, at about 48%, and low-carbon sources, at about 47%. Coal dominated the fossil share, supplying roughly 45% of electricity, while gas provided about 3%. Among clean sources, wind supplied more than a quarter, nuclear about 16%, and hydropower about 3%. Net imports accounted for approximately 4%; their generation mix is not specified.
Is Electricity Growing in Nebraska?
Electricity consumption in Nebraska is growing: the latest 2026 figure reached about 21,300 kWh per person, surpassing the previous record of roughly 20,500 kWh in 2025. That represents an increase of about 750 kWh per person, or nearly 4%, a welcome expansion as electrification and AI increase electricity demand. Low-carbon electricity generation, however, has not reached a new peak. At approximately 10,100 kWh per person, it remained about 60 kWh below its 2023 record. This near-stagnation underscores the need to accelerate clean electricity growth alongside rising consumption.
Suggestions
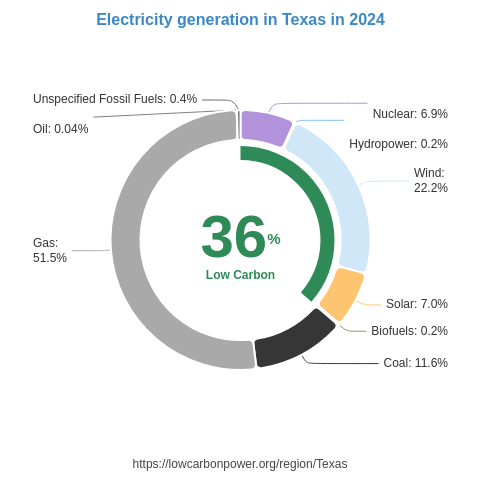
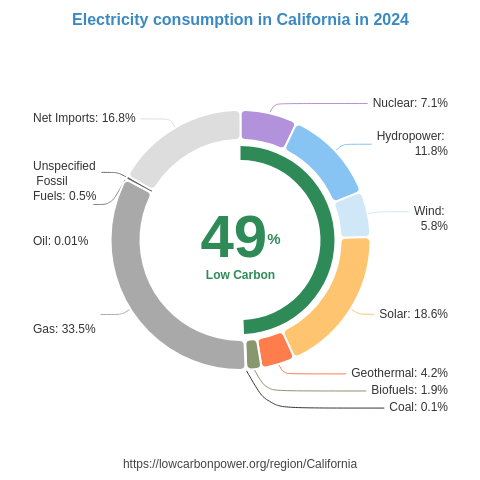
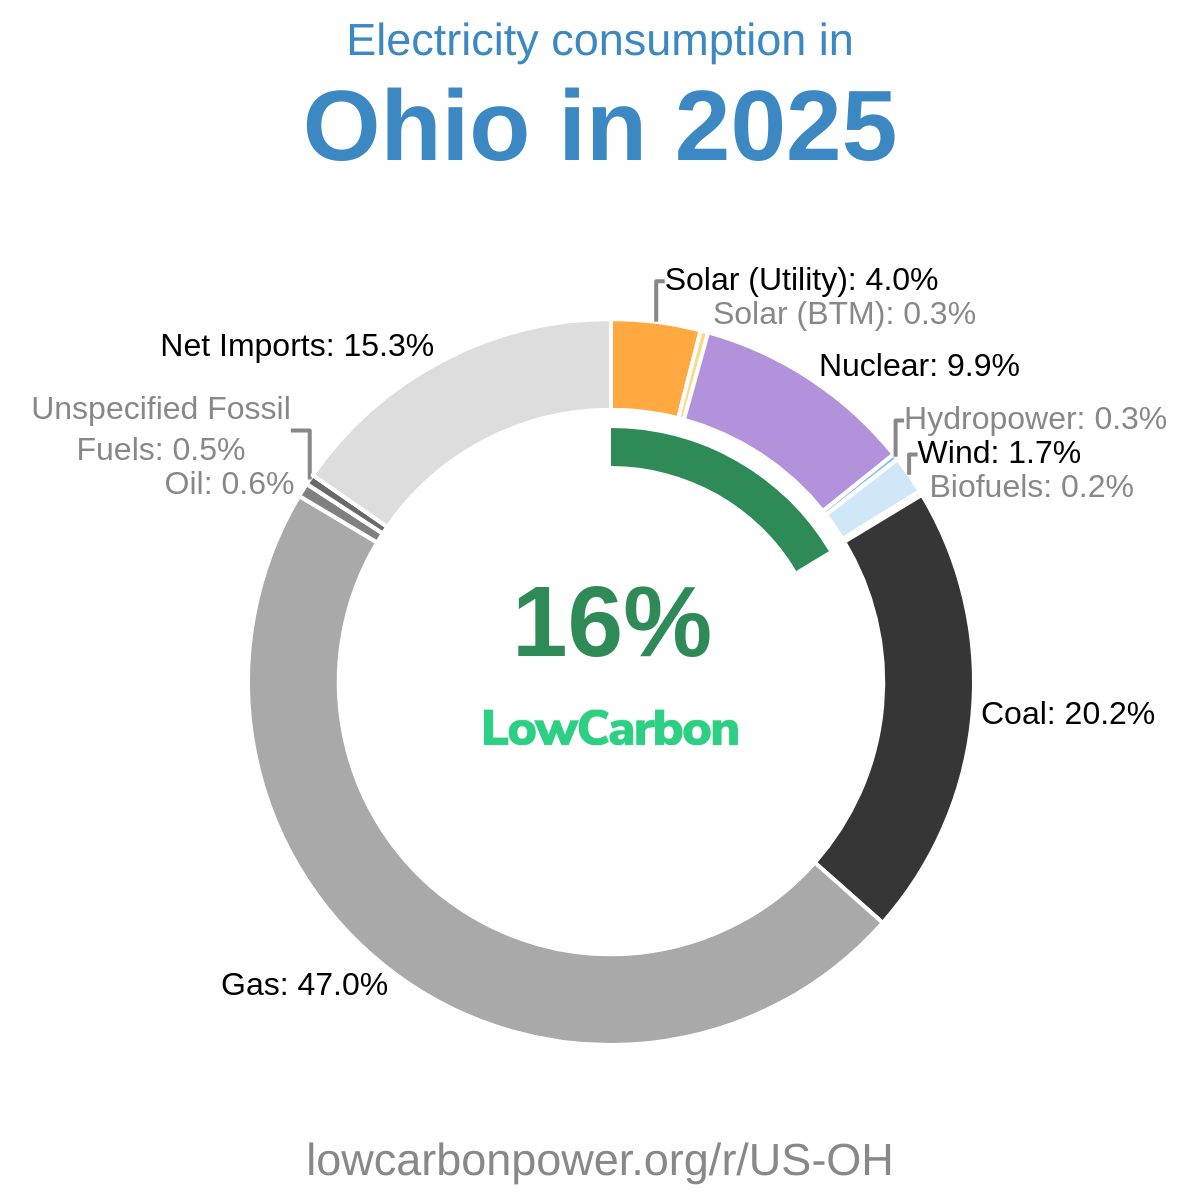
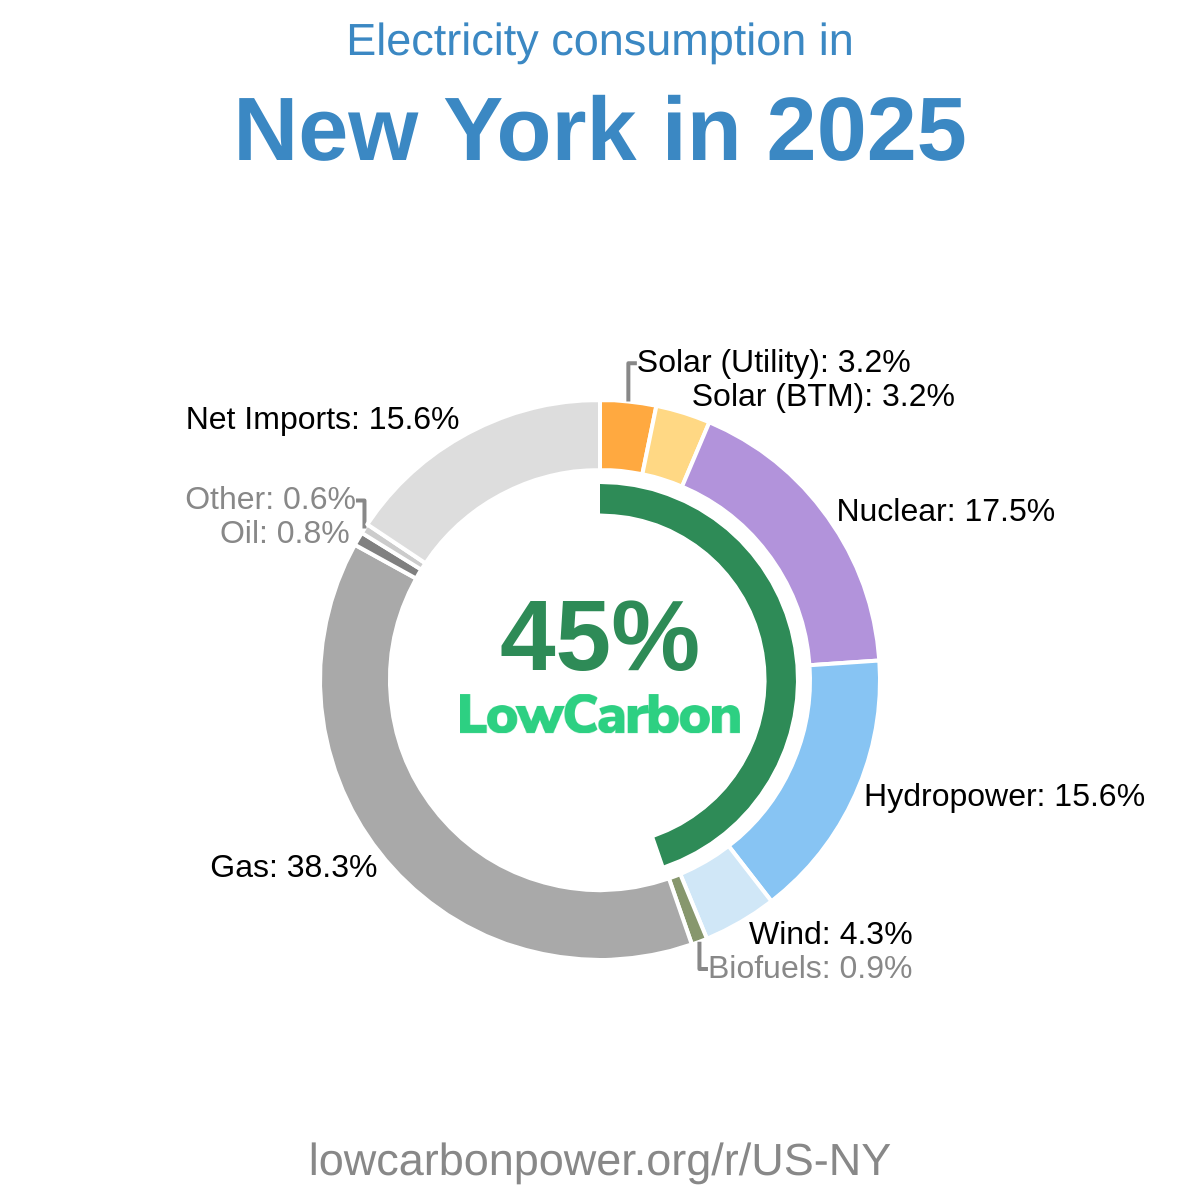
Nebraska can build on its substantial wind and nuclear generation by expanding both, while also developing solar electricity. Nearby US states offer particularly relevant examples: wind supplies about 57% of electricity generation in the US state of Iowa, 56% in South Dakota, and 49% in Kansas. Nebraska can learn from these regions’ success in scaling wind generation and supporting grid infrastructure. For nuclear, the US state of Illinois generates almost half its electricity from this clean source, while France generates about two-thirds. Expanding existing nuclear capacity where feasible and considering additional reactors would strengthen Nebraska’s low-carbon supply. Solar offers another major opportunity: it supplies about 14% of electricity generation in the US state of Colorado and 20% in Utah, demonstrating its potential to complement Nebraska’s existing clean electricity sources and displace coal, reducing climate-changing emissions and air pollution.
* 12M = Last 12 months (Jul 2025 – Jun 2026) — a rolling 12-month period, not a calendar year.
History
The supplied history covers 2024–2026 and shows uneven progress in Nebraska’s low-carbon electricity generation. Nuclear output fell by 0.8 TWh in 2024 before recovering by the same amount in 2025, then remained unchanged in 2026; this recovery was welcome, but sustained growth is needed beyond restoring earlier output. Wind generation was flat in 2024 and declined by 0.2 TWh in each of the following two years, a disappointing setback for clean electricity expansion. Hydropower was unchanged in 2024 and 2025 before increasing by 0.3 TWh in 2026, while biofuels generation remained unchanged throughout. Overall, these recent changes highlight the importance of sustained additions to nuclear, wind, and solar generation.
* 12M = Last 12 months (Jul 2025 – Jun 2026) — a rolling 12-month period, not a calendar year.
Electricity Imports and Exports
Balance of Trade
* 12M = Last 12 months (Jul 2025 – Jun 2026) — a rolling 12-month period, not a calendar year.
Nearby Regions