In Latvia, electricity consumption over the past year from June 2025 to May 2026 has seen a strong inclination towards low-carbon sources, comprising more than three-fifths of the total energy mix. Hydropower is the dominant source, contributing nearly half of Latvia's electricity from all low-carbon sources, emphasizing its ongoing significance in the energy matrix. On the fossil fuel side, which accounts for roughly a quarter of the electricity, natural gas holds the majority share. Meanwhile, the remaining power generation sees solar energy making impressive strides with nearly one-eighth of the total, highlighting its potential to further enhance clean energy solutions. Lastly, net imports and biofuels are minor players in the mix, each contributing almost another one-eighth combined, which indicates a reasonably diversified pool of energy resources.
Is Electricity Growing in Latvia?
In analyzing Latvia's electricity consumption record, the latest numbers reflect a very slight decline from 2018’s peak, albeit still close to that all-time high. The most recent consumption of 3952 kWh per person represents just a negligible drop compared to the previous high of 3960 kWh per person. However, there is a concerning trend in low-carbon electricity generation, marked by a decline from a 2017 record to the current figure, with a negative shift of 350 kWh per person. This stagnation in clean energy generation is worrying, as it could hinder Latvia's transitions to a sustainable future, leaving space for fossil fuels to maintain their share and potentially causing increased challenges in meeting environmental goals.
Suggestions
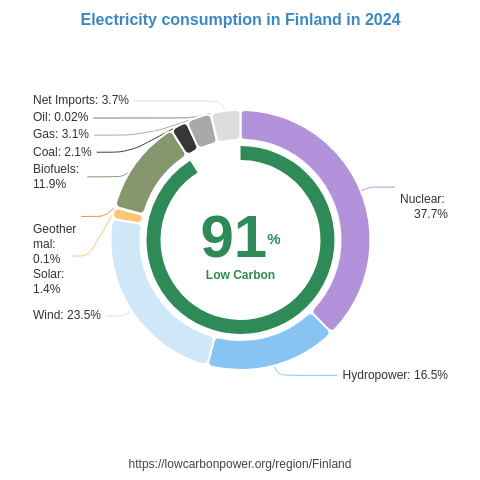
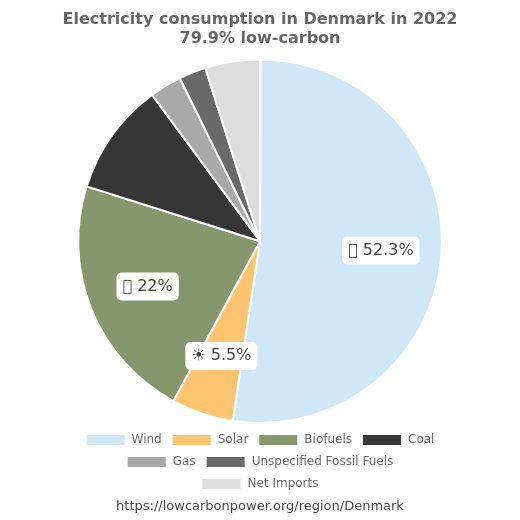
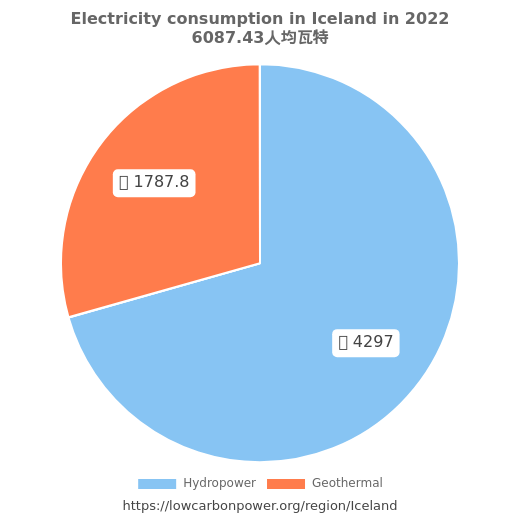
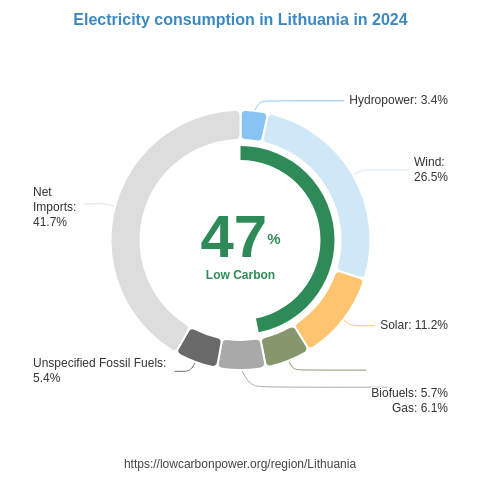
Latvia can look towards efficient and proven strategies to expand its low-carbon energy production. Considering the notable achievements in solar power generation within the country, further investment and expansion in solar infrastructure would be a prudent strategy. Moreover, learning from countries like France and Slovakia with their extensive nuclear programs can guide Latvia in establishing or expanding nuclear power, an integral source of plentiful and stable low-carbon energy. Additionally, emulating Denmark and Iowa's success with wind energy is another strategic approach as Latvia can take advantage of its geographic and climatic conditions. Diversifying further into these areas will not only strengthen energy security but also ensure a cleaner, sustainable electricity future.
* 12M = Last 12 months (Jun 2025 – May 2026) — a rolling 12-month period, not a calendar year.
History
Historically, Latvia's journey in low-carbon electricity generation has experienced several significant fluctuations, particularly within the hydropower sector. During the late 1980s and early 1990s, there were both notable increases and decreases, indicating the volatile nature of hydropower at the time. In the mid-1990s, the water-based source made recoveries, just to encounter declines again. Entering the 21st century, there were further dips, albeit interrupted by occasional upturns around mid-decade and again in 2016 and 2023, hinting at a resurgence. These changes highlight not only the adaptability but also the necessity for diversification into other low-carbon sources to ensure energy stability, marking the significance for modern advancements in clean electricity, such as solar and nuclear, in Latvia's evolving energy landscape.
* 12M = Last 12 months (Jun 2025 – May 2026) — a rolling 12-month period, not a calendar year.
Electricity Imports and Exports
Balance of Trade
* 12M = Last 12 months (Jun 2025 – May 2026) — a rolling 12-month period, not a calendar year.
Nearby Regions