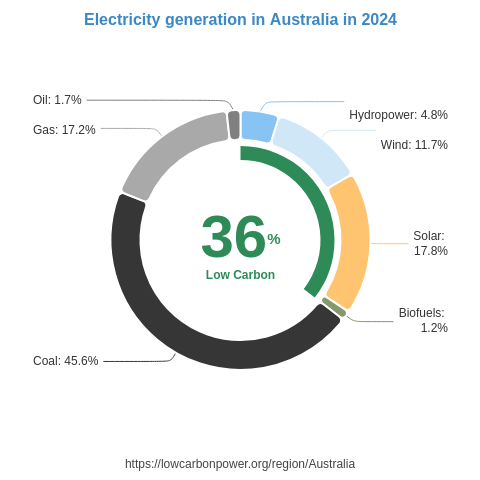


Costa Rica already gets an impressive 97% of its electricity from low-carbon sources. Over the 12 months from July 2025 through June 2026, hydropower supplied almost three-quarters of electricity consumption, wind about 13%, and geothermal about 11%. Fossil sources accounted for just under 3%, leaving electricity supply overwhelmingly clean. The next challenge is to electrify transport, heating and industry, which will require much more electricity while helping reduce fossil-fuel use, climate emissions and air pollution.
Is Electricity Growing in Costa Rica?
Electricity consumption per person is not currently growing: the latest 2026 figure is about 2,540 kWh, slightly below the 2025 record of about 2,550 kWh—a reported decline of around 14 kWh per person. Low-carbon electricity generation also slipped, reaching about 2,470 kWh per person, down roughly 48 kWh from its 2025 record of about 2,520 kWh. These modest declines are concerning because electrification and growing digital demand require expanding clean electricity supply, not stagnation.
Suggestions
Costa Rica can build on its successful wind sector by expanding existing wind facilities and developing additional projects. Solar electricity also offers an opportunity to broaden clean supply, while nuclear deserves consideration as another source of low-carbon electricity for future demand. Planning new generation alongside grid upgrades and storage would help turn Costa Rica’s exceptionally clean electricity mix into a larger supply capable of supporting transport, heating, industry and AI-related demand.
* 12M = Last 12 months (Jul 2025 – Jun 2026) — a rolling 12-month period, not a calendar year.
History
Costa Rica’s low-carbon electricity history is marked by substantial hydropower growth, alongside important geothermal and wind additions. In the early 1980s, hydropower increased by 0.5 TWh in 1980 and 0.4 TWh in 1983. The 1990s brought a 0.5 TWh geothermal gain in 1992 and uneven hydro growth: declines in 1995 and 1998 were offset by increases of 1 TWh in 1997 and 0.8 TWh in 1999. During the 2000s, four notable hydro increases each added around 0.5–0.6 TWh. Growth continued with hydro gains of 1.3 TWh in 2015 and 0.7 TWh in 2017, followed by a 0.5 TWh wind increase in 2018. In 2019, geothermal added 0.5 TWh while hydro fell by 0.6 TWh. Hydro then increased by 0.5 TWh in 2020 and 1 TWh in 2021; after a disappointing 0.9 TWh decline in 2023, its strong 1.6 TWh increase in 2025 was the largest annual gain listed.
* 12M = Last 12 months (Jul 2025 – Jun 2026) — a rolling 12-month period, not a calendar year.
Electricity Imports and Exports
Balance of Trade
* 12M = Last 12 months (Jul 2025 – Jun 2026) — a rolling 12-month period, not a calendar year.
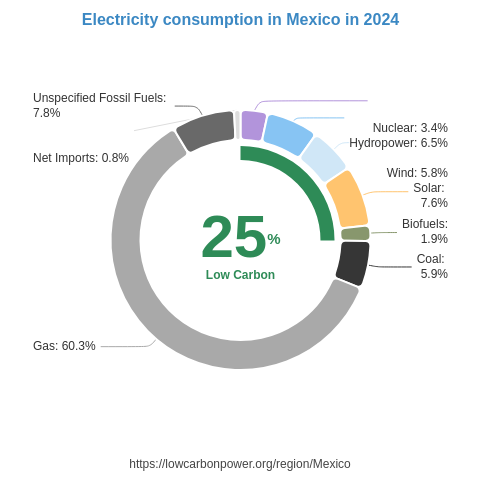
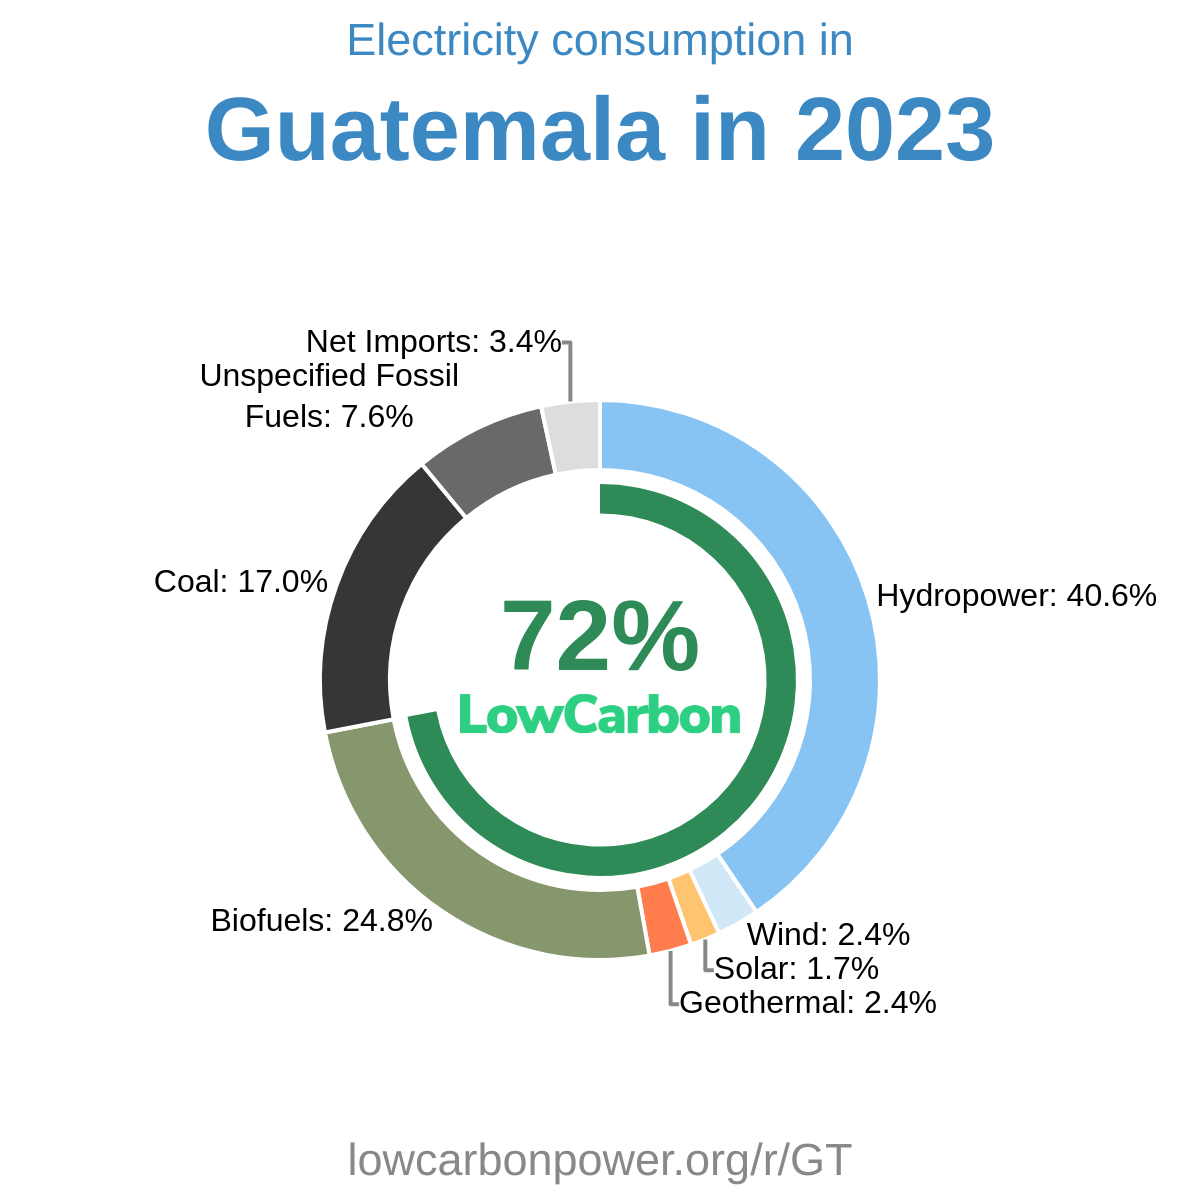
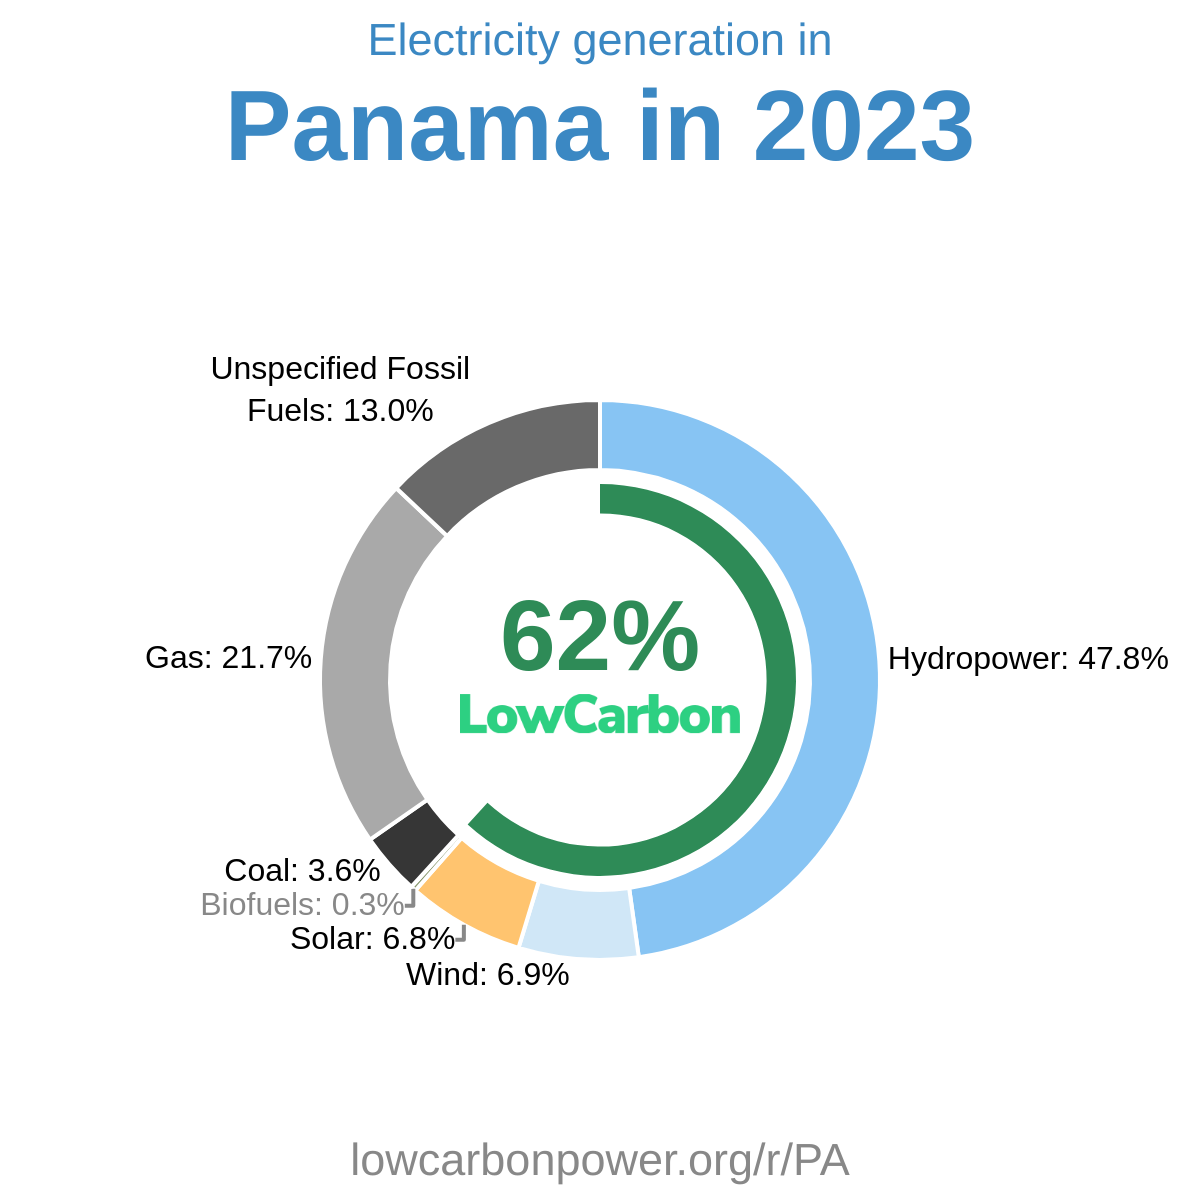
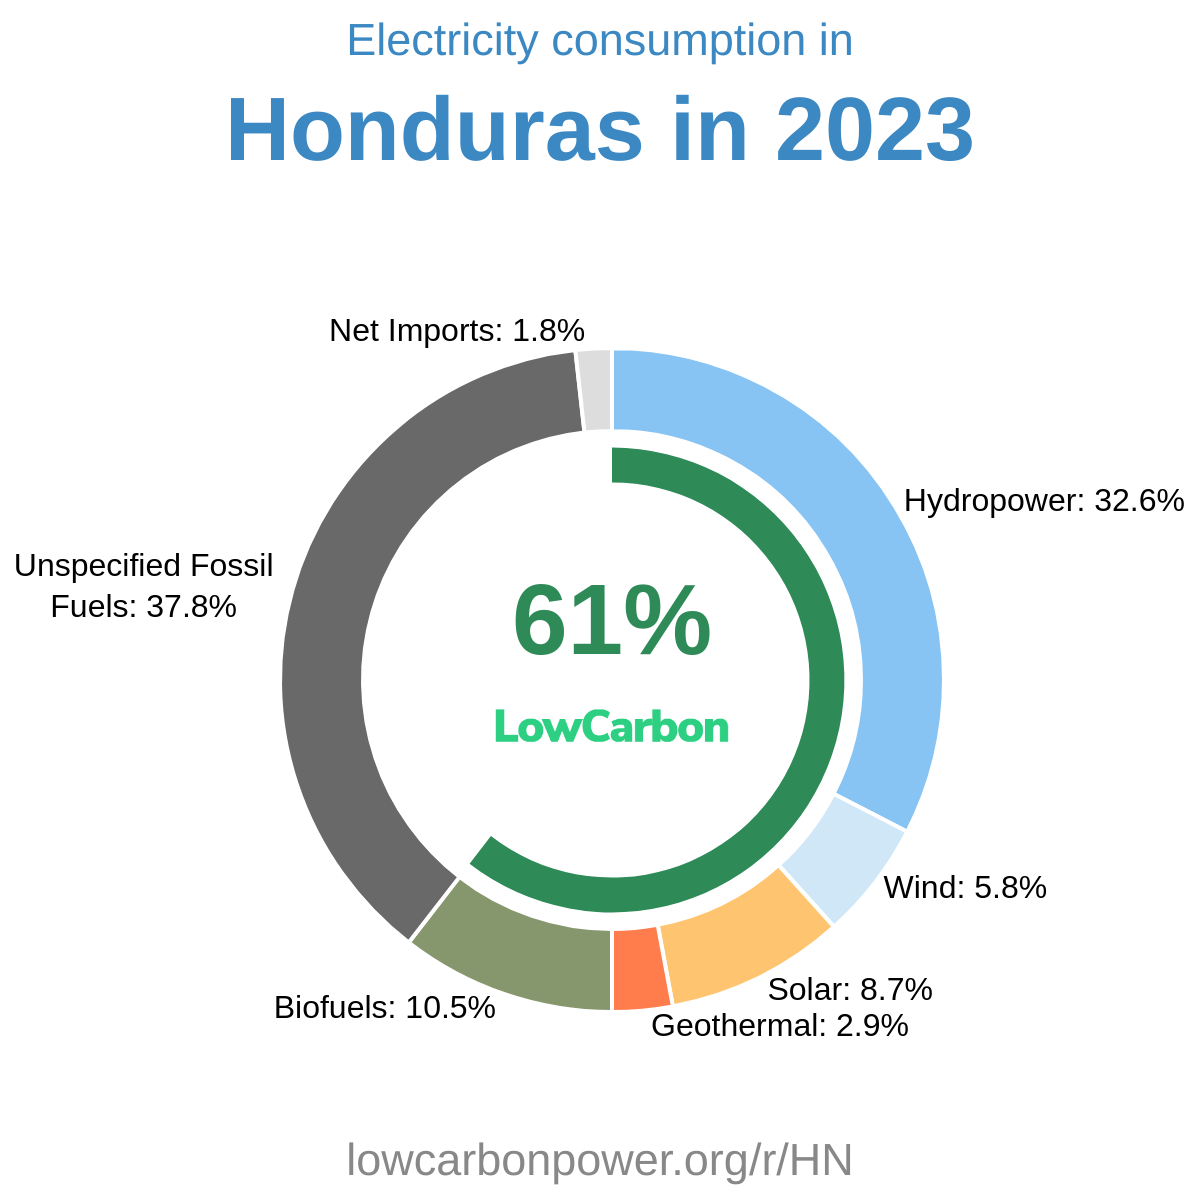
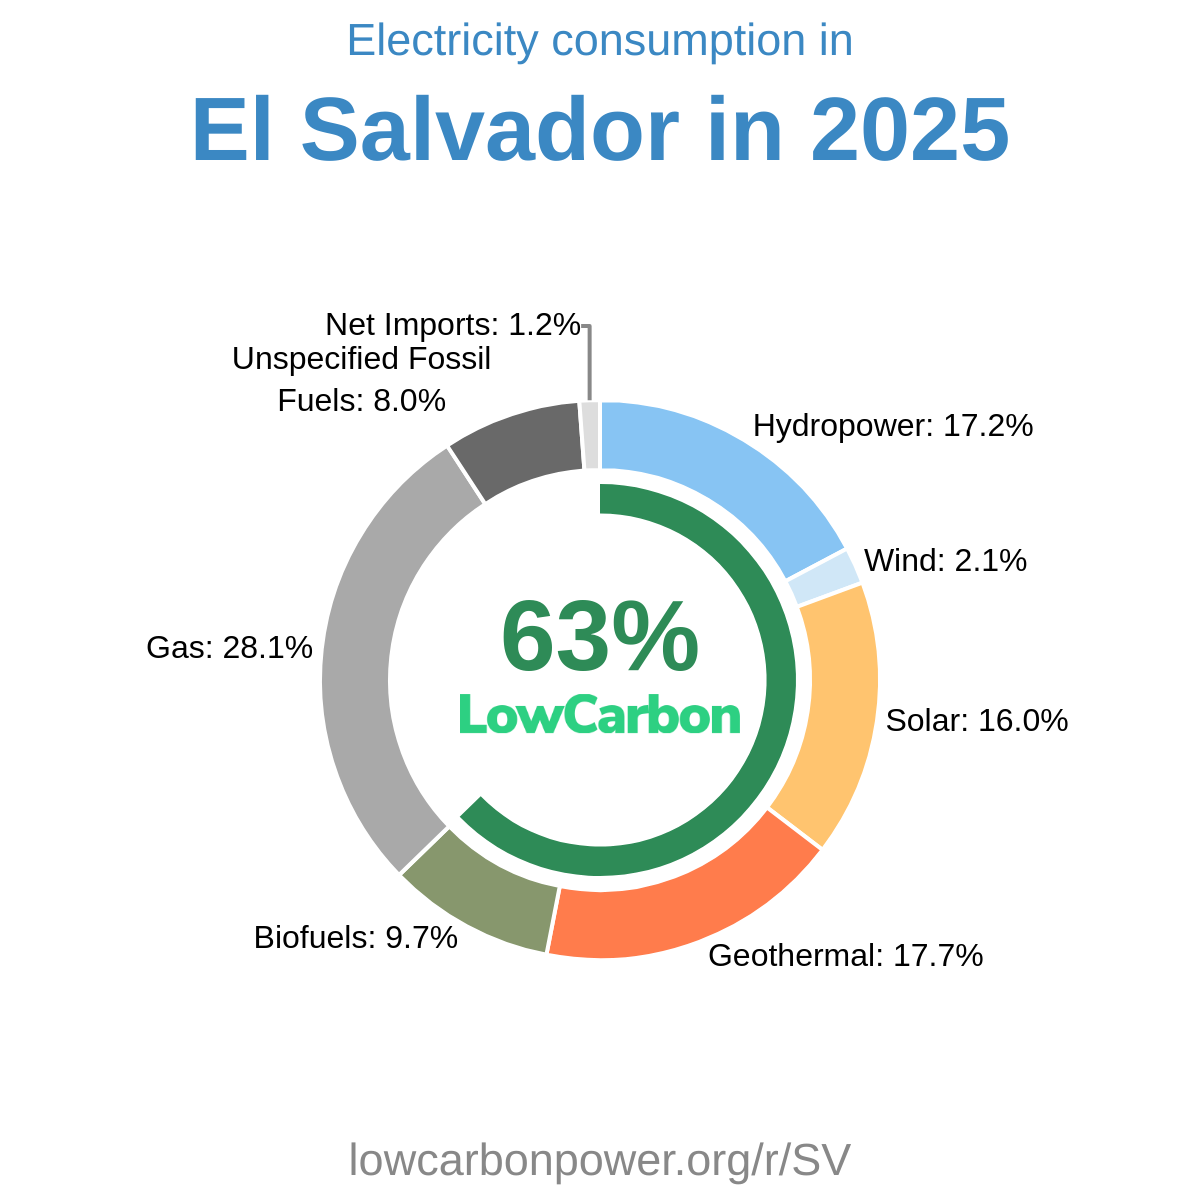
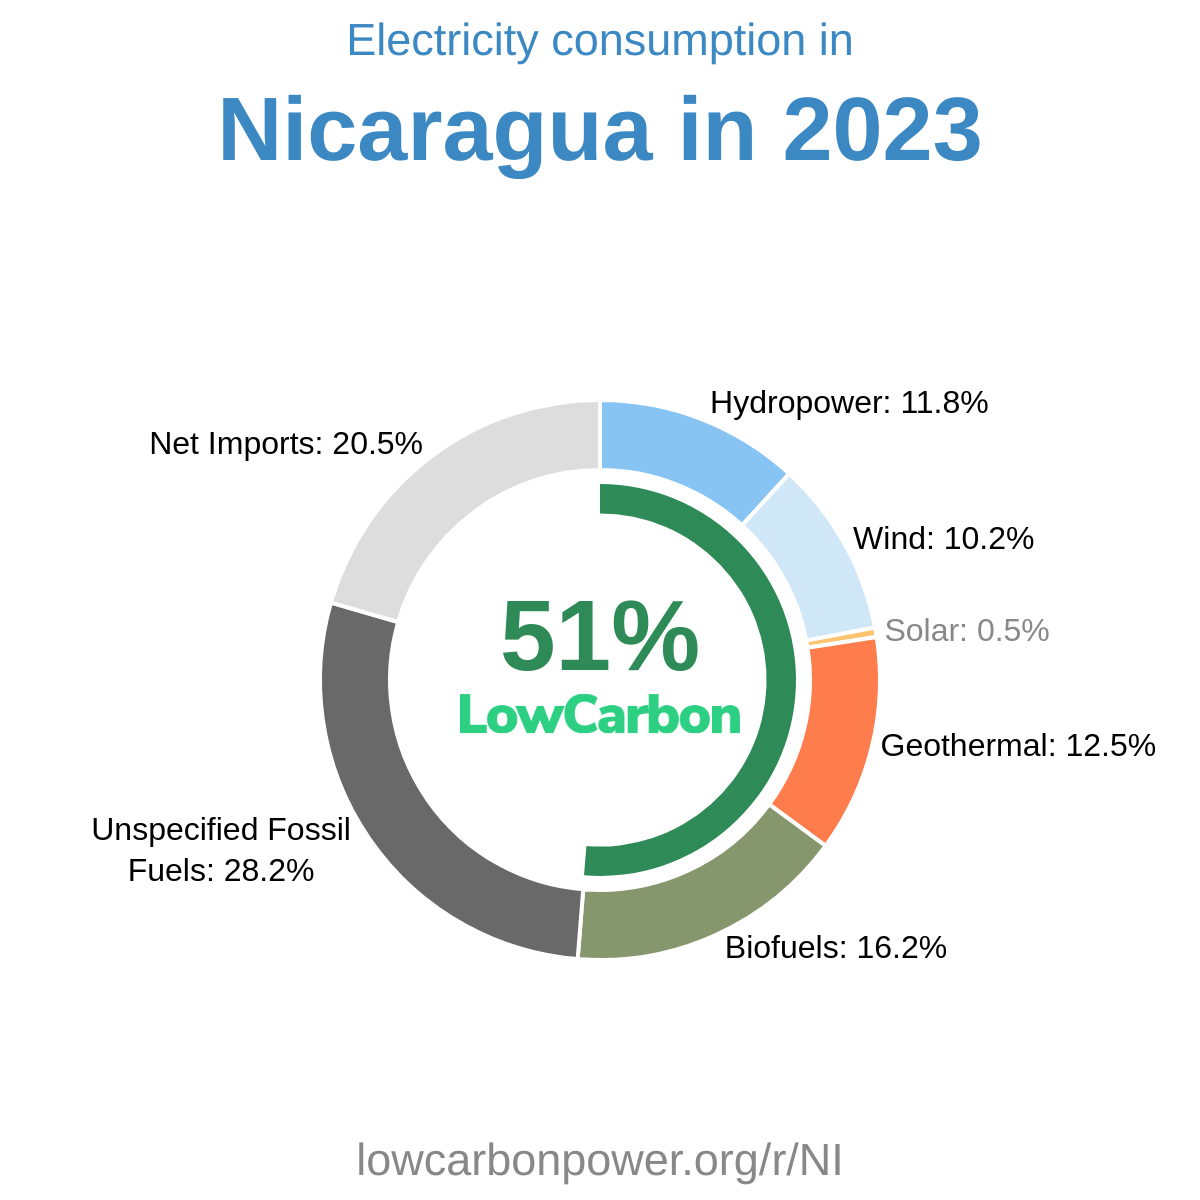
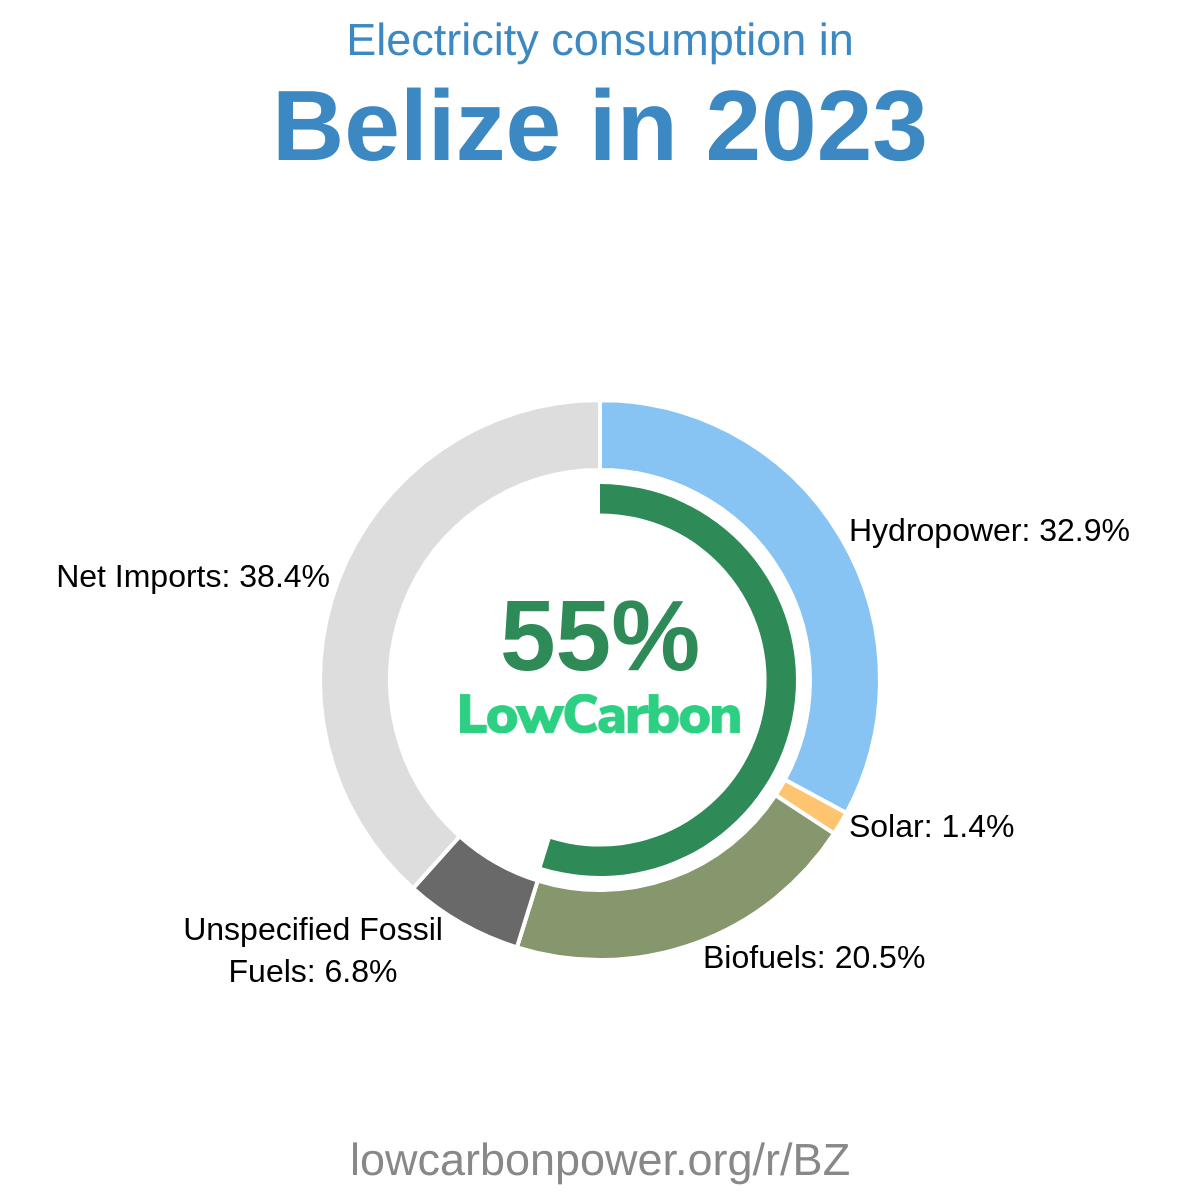
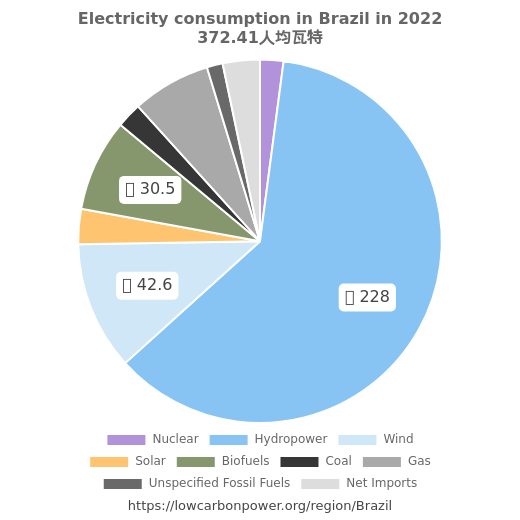
Nearby Regions