From July 2025 through June 2026, more than two-thirds of Oregon’s electricity consumption came from low-carbon sources, while almost a third came from fossil gas. Hydropower supplied nearly half of the total, making it the largest clean electricity source, followed by wind at about 14% and solar at about 5%. Solar included roughly 4% from utility-scale installations and 1% from behind-the-meter systems, such as rooftop panels. Biofuels contributed about 1%. Overall, Oregon has a strong low-carbon electricity mix, but gas still represents a substantial share, with associated climate and air-pollution impacts.
Is Electricity Growing in Oregon?
Electricity consumption per person is growing in Oregon, reaching a new record of about 16,100 kWh in the latest 2026 figures, compared with about 16,000 kWh in 2025—a rise of roughly 160 kWh, or 1%. Low-carbon electricity generation per person grew much faster, reaching about 11,000 kWh, up from roughly 10,100 kWh in 2025. That increase of about 925 kWh, or 9%, is an encouraging clean-electricity milestone. These figures demonstrate growth per person; without population data, they do not establish the change in statewide total electricity consumption.
Suggestions
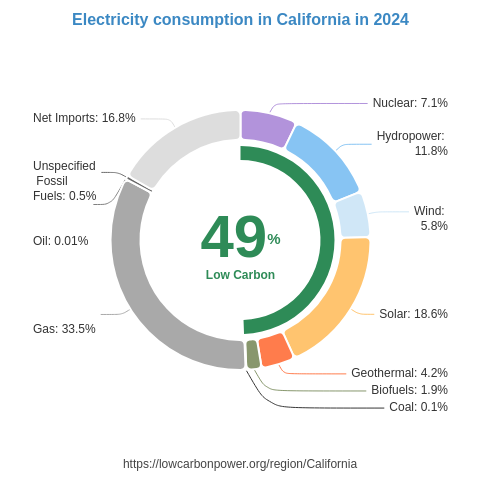
Oregon can build on its substantial wind generation by expanding existing wind capacity, while also increasing solar generation and considering nuclear power. Useful examples include the US states of Iowa and South Dakota, where wind supplies more than half of electricity generation. Nearby western regions offer strong solar examples: the US state of California generates almost a third of its electricity from solar, while the US state of Nevada generates about 35%. For nuclear, Oregon can learn from the US state of Arizona, where it supplies a quarter of electricity generation, and the US state of Illinois, where it supplies almost half. Together, expanded wind, solar and nuclear could strengthen Oregon’s clean electricity supply, reduce reliance on fossil gas, and support rising demand from electrification and AI.
* 12M = Last 12 months (Jul 2025 – Jun 2026) — a rolling 12-month period, not a calendar year.
History
From 2024 through 2026, Oregon’s low-carbon electricity growth was led by increasingly large hydropower gains. Hydro generation rose by 0.6 TWh in 2024, 2.2 TWh in 2025 and 3.3 TWh in 2026—an encouraging cumulative increase of 6.1 TWh. Wind grew by 0.6 TWh in 2024, slipped by 0.1 TWh in 2025, and returned to growth with a 0.4 TWh increase in 2026. Biofuel generation rose slightly in 2024, declined slightly in 2025 and remained unchanged in 2026, while geothermal generation showed no change throughout the period. These recent gains are welcome, especially wind’s recovery, and sustained expansion across clean electricity technologies would help Oregon meet future demand.
* 12M = Last 12 months (Jul 2025 – Jun 2026) — a rolling 12-month period, not a calendar year.
Electricity Imports and Exports
Balance of Trade
* 12M = Last 12 months (Jul 2025 – Jun 2026) — a rolling 12-month period, not a calendar year.
Nearby Regions


.png)