From October 2025 through September 2026, low-carbon sources supplied about two-thirds of Portugal’s electricity consumption. Hydropower contributed roughly 27%, wind 20%, solar 14%, and biofuels 5%. Fossil fuels supplied around 15%, predominantly gas at nearly 13%, with oil contributing about 2%. Net imports accounted for the remaining 19%; their low-carbon or fossil composition is not specified. Clean electricity therefore dominates Portugal’s domestic supply, although fossil generation still contributes to climate change and air pollution.
Is Electricity Growing in Portugal?
Electricity consumption in Portugal is growing: the latest 2026 figure reached 6,284 kWh per person, exceeding the previous record of 6,056 kWh in 2025 by 228 kWh, or almost 4%. However, low-carbon electricity generation did not keep pace. It reached 4,182 kWh per person, down 83 kWh, or about 2%, from the 2025 record of 4,265 kWh. The new consumption record is encouraging for an increasingly electrified economy, but the decline in clean generation is concerning. Portugal needs faster low-carbon electricity growth to meet rising demand from electrification and AI.
Suggestions
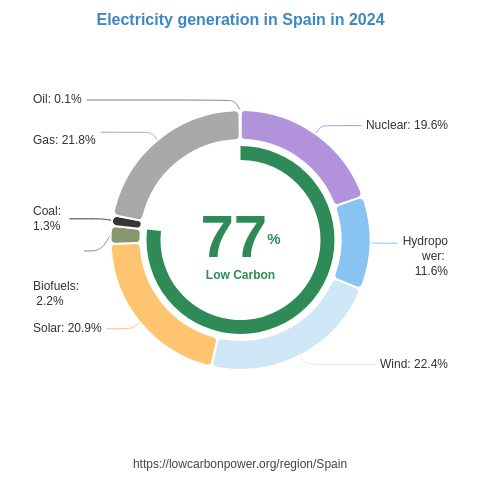
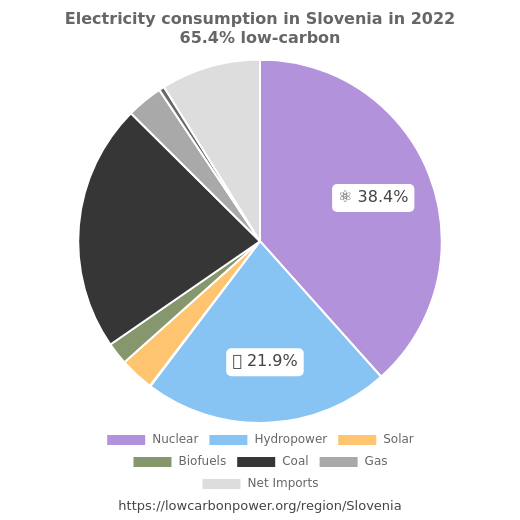
Portugal can build on its substantial wind and solar generation by expanding both technologies, alongside the grids and storage that support their deployment. Ireland, where wind supplies 34% of electricity generation, offers a useful Atlantic comparison, while Denmark’s 59% wind share demonstrates the potential for further expansion. For solar, Portugal can learn from sunny regions such as Chile, with 24%, and the US state of California, with 31%. Portugal should also consider building nuclear generation to complement its existing clean electricity sources. Neighbouring Spain generates 18% of its electricity from nuclear, while France generates 67%, providing relevant European examples of nuclear’s contribution to a low-carbon electricity supply.
* 12M = Last 12 months (Oct 2025 – Sep 2026) — a rolling 12-month period, not a calendar year.
History
Portugal’s recorded low-carbon electricity history is marked by large year-to-year changes in hydropower. Generation rose by about 5 TWh in 1977, before falling by roughly 6 TWh in 1989. The 1990s brought declines of around 4 TWh in 1992 and 5 TWh in 1999, alongside a 6 TWh rebound in 1996. The early and mid-2000s continued this pattern: declines in 2002, 2004 and 2005 contrasted with gains of almost 8 TWh in 2003 and 6 TWh in 2006. During the 2010s, substantial increases in 2010, 2013, 2016 and 2018 alternated with declines, including the largest listed drop—more than 9 TWh in 2017. More recently, hydropower fell by nearly 5 TWh in 2022 before recovering by 6 TWh in 2023. These swings reinforce the value of expanding a diverse low-carbon electricity mix, including solar, wind and nuclear.
* 12M = Last 12 months (Oct 2025 – Sep 2026) — a rolling 12-month period, not a calendar year.
Electricity Imports and Exports
Balance of Trade
* 12M = Last 12 months (Oct 2025 – Sep 2026) — a rolling 12-month period, not a calendar year.
Nearby Regions