Over the past 12 months, from June 2025 to May 2026, Romania's electricity consumption reveals a mixture of energy sources, with clean energy accounting for more than two-thirds of the total electricity produced. Hydropower has the largest share among these clean sources, contributing about a quarter to the overall electricity generation. Nuclear energy follows, providing nearly 19%, while wind and solar contribute roughly 12% and 9%, respectively. Fossil fuels, which are less environmentally friendly, still represent close to a third of the country's energy mix, highlighting a significant dependence on gas and coal. The reliance on gas stands at around 17%, and coal at nearly 11%. The country also utilizes some electricity imports, albeit a small share.
Is Electricity Growing in Romania?
Romania's electricity consumption is not increasing. Currently, each person consumes around 2678 kWh, which is a stark decrease from the historical high of 3487 kWh per person achieved in 1989. This indicates a drop of over 800 kWh per person. Its clean electricity generation is also not meeting previous records, with 1803 kWh per person now compared to the peak of 2026 kWh per person in 2023. The reduction in clean electricity by about 223 kWh per person is concerning, as it suggests a step backward in achieving low-carbon electricity goals.
Suggestions
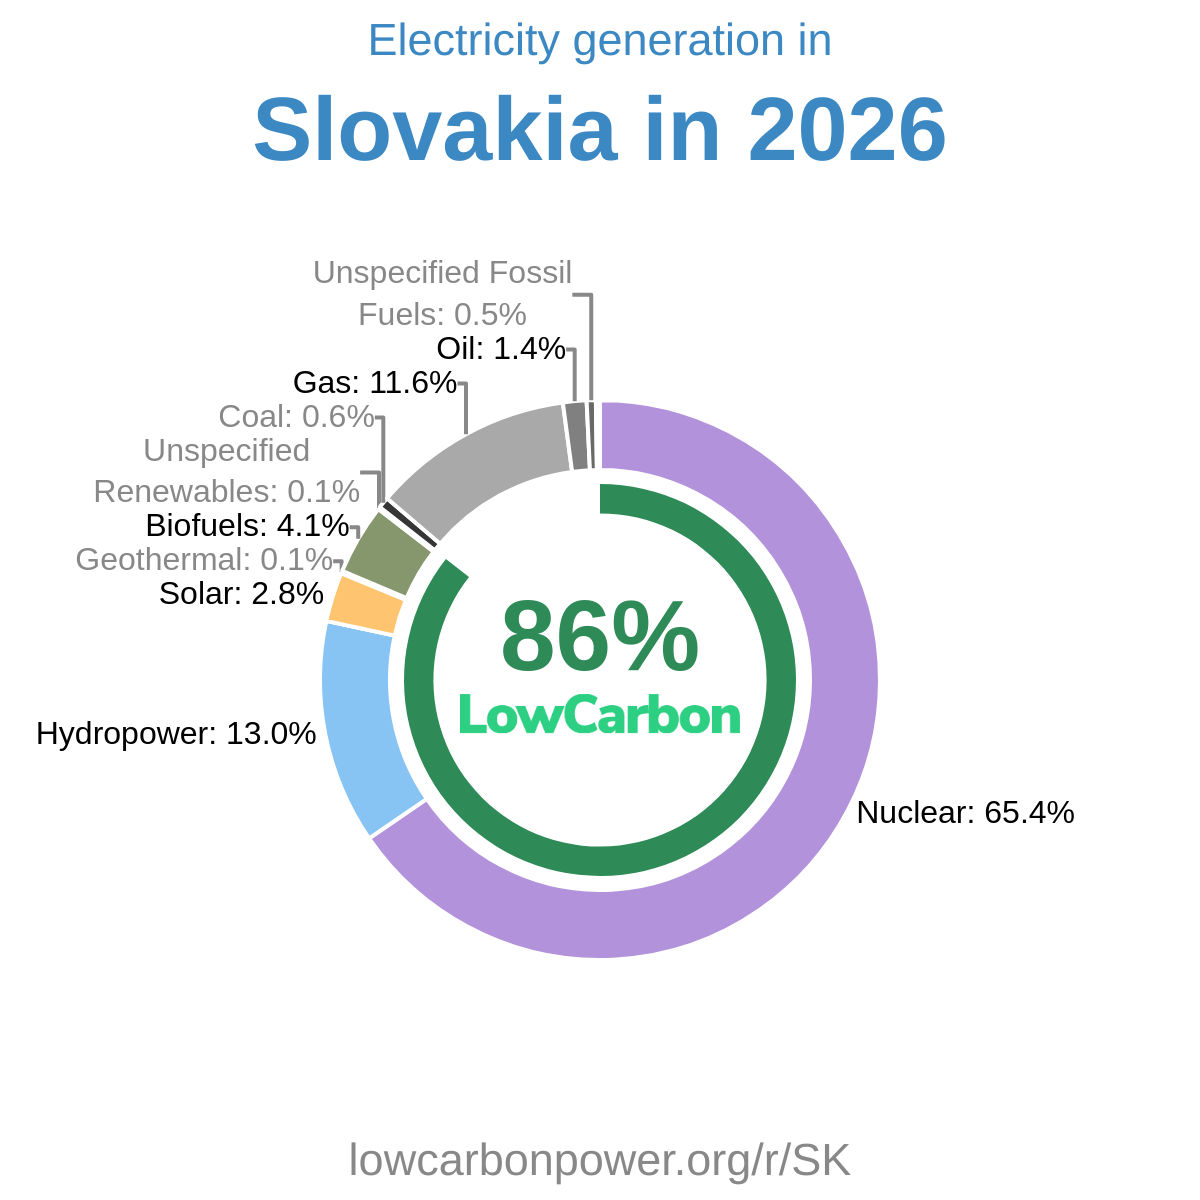
For Romania to boost its clean energy generation, focusing on expanding its nuclear and wind capacities is essential, as these are already substantial contributors to the country's electricity. Romania can look to countries like France and Slovakia, where nuclear makes up a significant portion of electricity production, at 67% and 65% respectively. Additionally, Romania can draw inspiration from Denmark and Iowa, where wind energy constitutes major parts of their electricity, at 60% and 57% respectively. These successful examples illustrate the potential of scaling up nuclear and wind energy, which could significantly drive Romania's clean electricity growth and help reduce reliance on fossil fuels.
* 12M = Last 12 months (Jun 2025 – May 2026) — a rolling 12-month period, not a calendar year.
History
Throughout history, Romania has witnessed fluctuations in its low-carbon electricity generation. In the early 1990s, there were noticeable shifts in hydropower, increasing by over 3 TWh in 1991 and then dropping by almost that amount in 1992. The mid to late 1990s saw nuclear stepping up with a notable increase of 4 TWh in 1997. The 2000s continued to show variations in hydropower with several large ups and downs, while nuclear showed another boost in 2008. More recently, in the 2010s and 2020s, hydropower continued to remain volatile, culminating in various increases and decreases with no significant gains in recent years. These patterns signify both the potential and challenges for Romania as it seeks to stabilize and grow its clean energy contributions.
* 12M = Last 12 months (Jun 2025 – May 2026) — a rolling 12-month period, not a calendar year.
Electricity Imports and Exports
Balance of Trade
* 12M = Last 12 months (Jun 2025 – May 2026) — a rolling 12-month period, not a calendar year.
Nearby Regions