In the period from June 2025 to May 2026, Lithuania's electricity consumption demonstrates a strong reliance on low-carbon energy sources, constituting more than half of the total electricity mix. Wind energy leads the charge, contributing almost 39% to the low-carbon category. Solar energy, while lagging behind wind, adds another 7%. Additionally, biomass and hydropower also play their roles, each contributing roughly 6% to the clean energy profile. In contrast, fossil fuels are a minor player in Lithuania's energy landscape, accounting for less than 10% of the total, with gas being the primary fossil fuel source. Net imports make up about 30% of the electricity used, indicating a reliance on external sources to fill the gap between domestic generation and demand.
Is Electricity Growing in Lithuania?
Lithuania's current electricity consumption raises concerns about its growth trajectory, especially when compared to historical records. The latest consumption figure sits at 4,284 kWh per person, which is significantly lower than the peak record of 7,933 kWh per person in 1991. Similarly, low-carbon electricity generation has also seen a decline, with the latest figures at 2,493 kWh per person, compared to the peak of 4,824 kWh per person back in 2003. These numbers indicate a drop of more than 3,600 kWh per person in total consumption and more than 2,300 kWh per person in low-carbon generation. This stagnation and even reduction in electricity use signify missed opportunities for growth, particularly in clean energy, which is at the frontline of combating climate change and fostering energy independence.
Suggestions
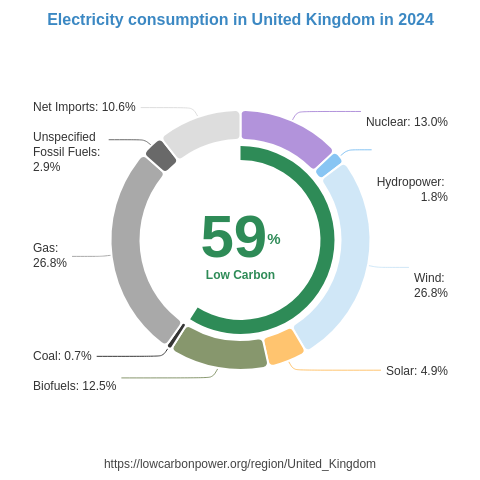
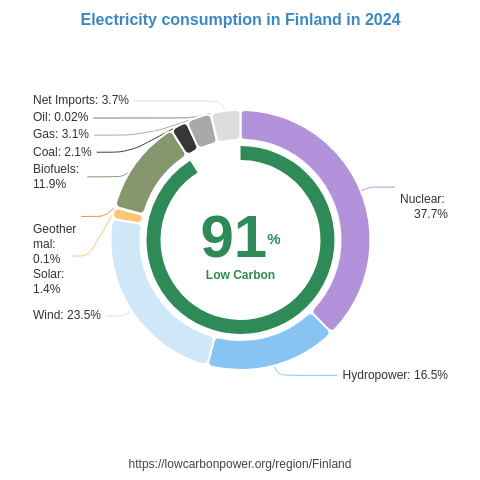
To boost its low-carbon electricity generation, Lithuania can take significant strides by expanding its wind energy capabilities, which already contribute a substantial portion of its electricity. Additionally, nuclear energy should be reconsidered as a sustainable investment to complement wind expansion. Lithuania can look to countries such as Finland, Slovenia, and Czechia, where nuclear energy contributes between 38% and 42% of their electricity, highlighting its viability as a reliable, large-scale clean energy source. Alongside nuclear, exploring solar opportunities, inspired by regions like California and South Dakotan wind investments, could further diversify and strengthen Lithuania's green portfolio. Expanding these clean technologies will not only make Lithuania less reliant on imported electricity but also position it as a leader in sustainable energy practices.
* 12M = Last 12 months (Jun 2025 – May 2026) — a rolling 12-month period, not a calendar year.
History
Lithuania's history with low-carbon electricity generation has had its ups and downs, particularly in the context of nuclear energy. In the late 1980s, nuclear energy was growing, with notable increases in electricity generation. However, the 1990s and early 2000s were marked by significant fluctuations, including years of decline that resulted in reduced nuclear output. Unfortunately, these declines affected Lithuania's overall clean energy standing. The early 2000s saw slight rebounds, but a substantial drop in 2005 led to decreased nuclear reliance. More recently, Lithuania has seen growth in wind energy, with consistent increases over 2023 and 2024, suggesting a positive trend in its commitment to clean, sustainable electricity generation. This historical insight emphasizes the necessity for robust, sustained investment in diverse, low-carbon technologies to ensure energy security and environmental stewardship.
* 12M = Last 12 months (Jun 2025 – May 2026) — a rolling 12-month period, not a calendar year.
Electricity Imports and Exports
Balance of Trade
* 12M = Last 12 months (Jun 2025 – May 2026) — a rolling 12-month period, not a calendar year.
Nearby Regions