Over the past twelve months, from May 2025 to April 2026, Ireland's electricity consumption has been characterized by a nearly equal mix of low-carbon and fossil-based sources. Low-carbon energy contributes more than 40% to the electricity mix, with wind power being the dominant force, generating over a third of Ireland's electricity. Hydropower, solar, and biofuels combined contribute almost a tenth of the total. Fossil energy, primarily driven by gas with an almost 40% share, accounts for just under 40% of the electricity supply. Net Imports are notable too, making up roughly 17% of the total electricity. This combination shows that while clean energy is leading the charge, fossil fuels still have a substantial grip on the electricity landscape in Ireland.
Is Electricity Growing in Ireland?
When we look at trends in electricity consumption in Ireland, we see a slight decrease in total consumption compared to historical levels. In 2026, the electricity consumption stands at 6785 kWh per person, slightly below the 2006 record of 6854 kWh per person, showing a small decline of 69 kWh per person. However, it's promising to note that the generation of low-carbon electricity has been on the rise, reaching 2938 kWh per person in 2026—this an increase of 137 kWh per person compared to the 2025 record. This shift towards cleaner energy is a positive sign, indicating a growing commitment to sustainable and environmentally-friendly power solutions in Ireland.
Suggestions
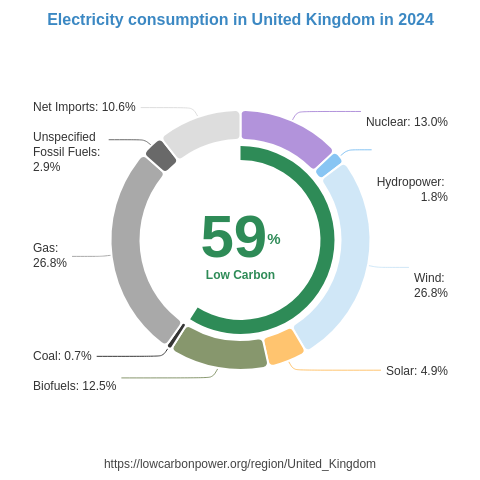
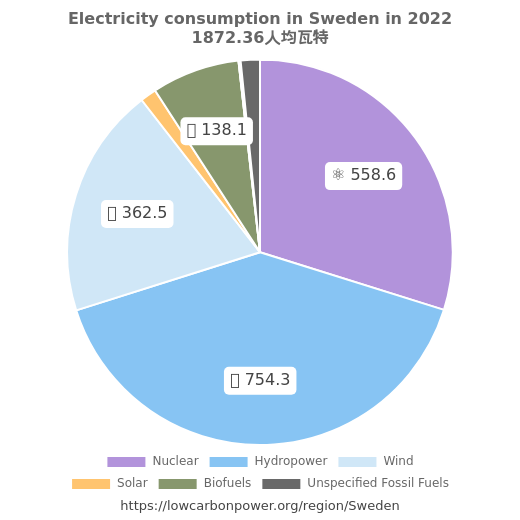
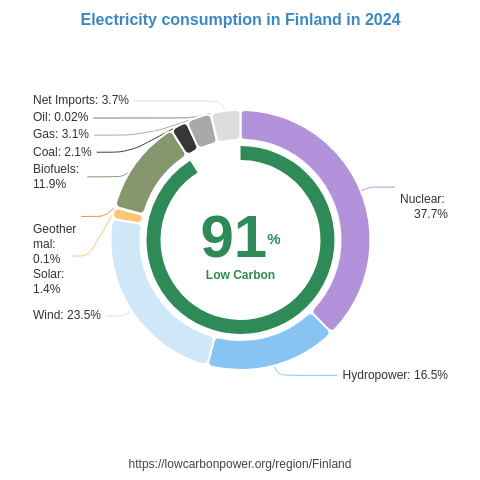
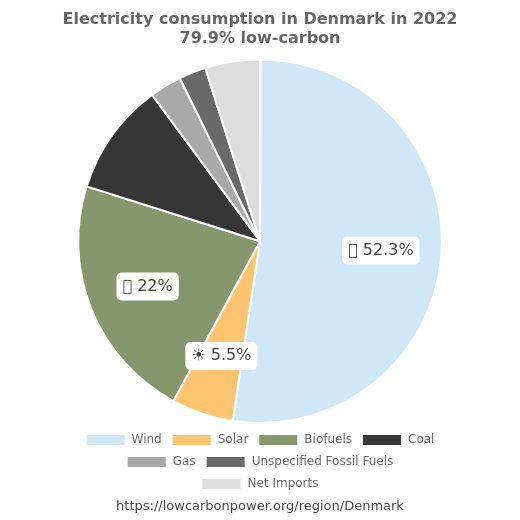
To further increase low-carbon electricity generation, Ireland can significantly expand its existing wind energy infrastructure, as wind already provides a substantial contribution. Learning from successful regions, Ireland can consider not only augmenting its wind capacity but also investing in solar and nuclear energy. Denmark, for instance, harnesses an impressive 60% of its electricity from wind, while states like Nevada and California are leaders in solar energy generation, with around 30% or more of their electricity coming from solar sources. Additionally, nuclear energy can offer a stable and substantial addition, as seen in France and Slovakia, where over half of their electricity comes from nuclear power. These examples provide Ireland with valuable insights into diversifying its clean energy mix beyond wind, further reducing reliance on fossil fuels and ensuring a sustainable energy future.
* 12M = Last 12 months (May 2025 – Apr 2026) — a rolling 12-month period, not a calendar year.
History
Historically, Ireland has seen significant growth in low-carbon electricity, especially from wind power, since the early 2000s. In the mid-2000s, annual increases were modest, but starting from 2011, wind energy saw an impressive boost, with increments reaching 1.6 TWh in that year alone. The years following witnessed continued growth with some fluctuations; for example, 2020 marked a peak with a 2.1 TWh increase in wind generation. While biofuel generation has seen some reductions in recent years, the overall trend in wind energy continues to rise. This history of robust expansion in wind energy, although sometimes unstable, indicates a strong foundation for further enhancement of Ireland's low-carbon electricity generation, urging for continued support and expansion of sustainable technologies like solar and nuclear.
* 12M = Last 12 months (May 2025 – Apr 2026) — a rolling 12-month period, not a calendar year.
Electricity Imports and Exports
Balance of Trade
* 12M = Last 12 months (May 2025 – Apr 2026) — a rolling 12-month period, not a calendar year.
Nearby Regions