

From July 2025 through June 2026, fossil fuels supplied more than three-fifths of Hawaii’s electricity consumption, all from oil. Low-carbon sources provided almost a third, led by solar at about 23%: roughly 15% from behind-the-meter systems, such as rooftop panels, and 8% from utility-scale installations. Wind supplied around 5%, geothermal about 2%, and biofuels just over 1%. Net imports were reported separately at about 4.5%, without an identified source mix. Hawaii therefore has a substantial clean electricity foundation, but oil still dominates, bringing climate-changing emissions and air pollution.
Is Electricity Growing in Hawaii?
Electricity consumption per person is growing, but only slightly. The latest 2026 figure reached about 8,114 kWh per person, narrowly exceeding the 2025 record of 8,086 kWh—an increase of roughly 27 kWh per person, or about 0.3%, using the supplied change. Low-carbon electricity generation remained at 2,575 kWh per person, matching its 2025 record rather than exceeding it. That clean electricity stagnation is concerning: stronger growth is needed to replace oil-fired electricity and meet future demand from electrification and expanding digital infrastructure. These per-person figures alone do not establish whether total statewide electricity consumption increased.
Suggestions
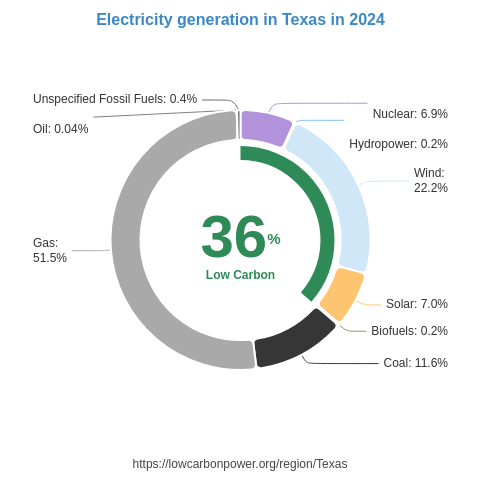
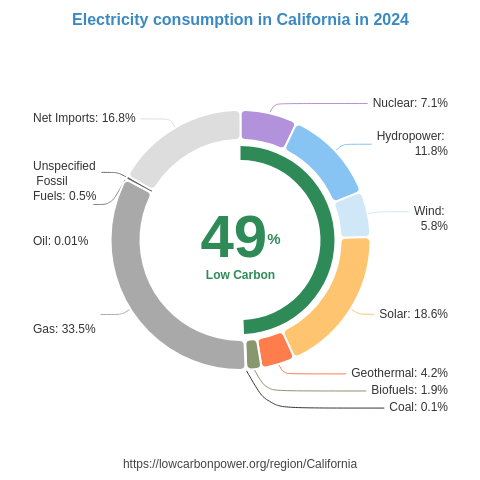
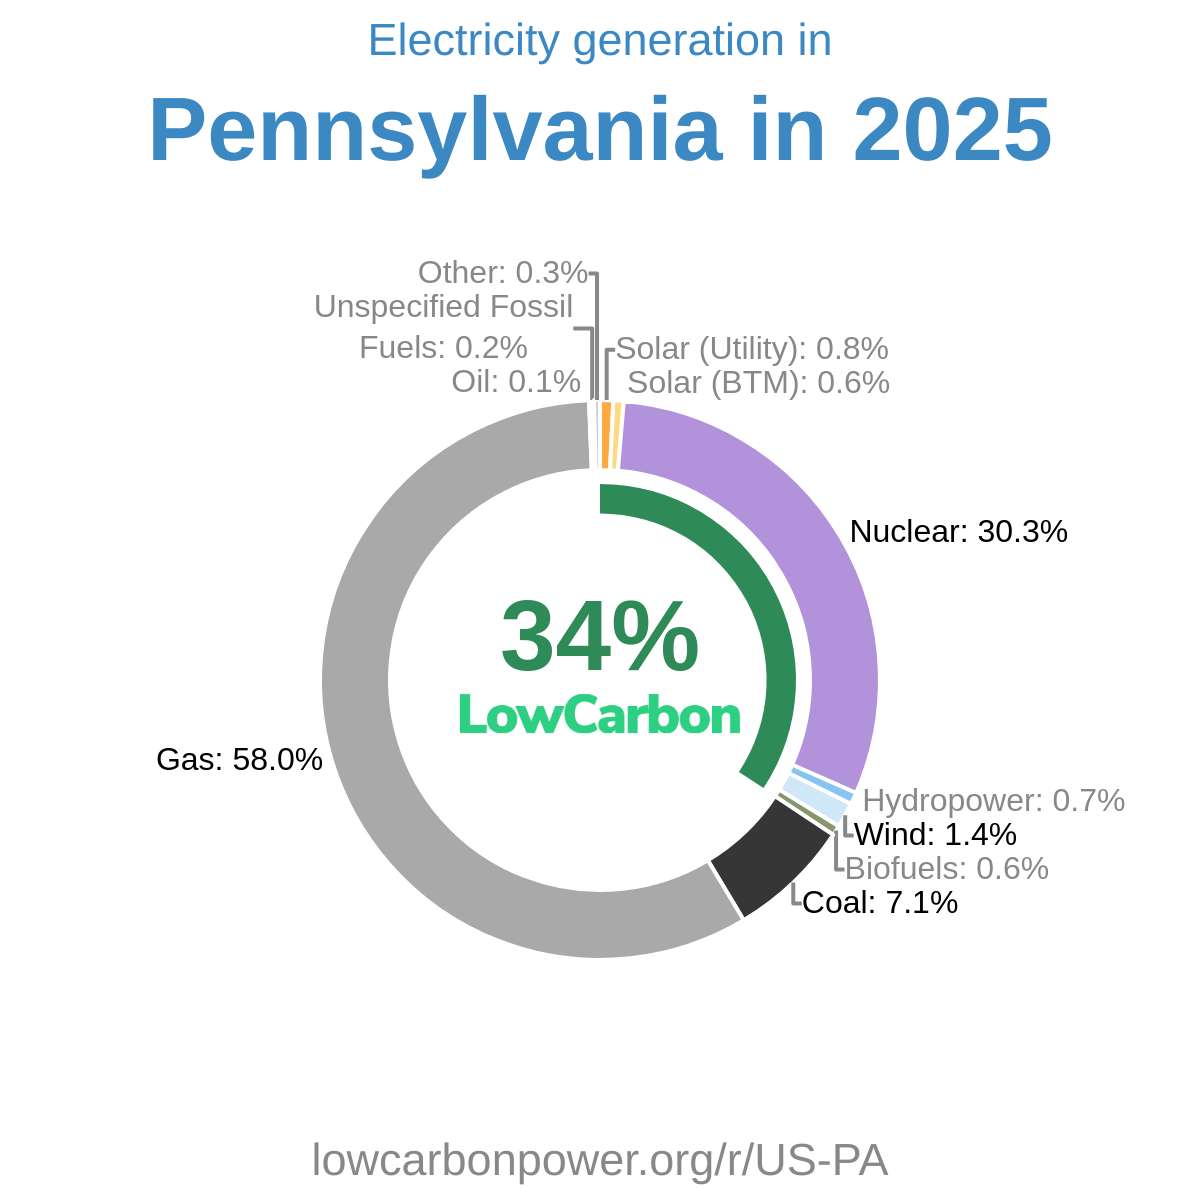
Hawaii should build on its substantial solar generation by expanding both rooftop and utility-scale solar, supported by storage and grid improvements. The US state of Nevada, where solar supplies 35% of electricity, offers a useful sunny-region comparison, while North Macedonia’s 40% solar share illustrates further potential. For wind, island regions such as Ireland and the United Kingdom provide relevant examples, generating roughly a third of their electricity from wind. Hawaii should also consider nuclear as part of its long-term clean electricity planning: France generates about two-thirds of its electricity from nuclear, while the US state of South Carolina gets just over half. These regions demonstrate how solar, wind, and nuclear can support a much larger low-carbon electricity supply.
* 12M = Last 12 months (Jul 2025 – Jun 2026) — a rolling 12-month period, not a calendar year.
History
The supplied history for 2024–2026 shows limited progress among the listed low-carbon sources. In 2024, geothermal generation increased by 0.1 TWh, offsetting a 0.1 TWh decline in biofuels, while wind and hydro were unchanged. In 2025, wind and hydro each fell by 0.1 TWh, with geothermal and biofuels flat—a disappointing loss of clean electricity generation. In 2026, all four listed sources recorded no change. These figures underline the need for renewed clean electricity growth, although the historical series does not include solar and therefore cannot establish the overall low-carbon trend by itself.
* 12M = Last 12 months (Jul 2025 – Jun 2026) — a rolling 12-month period, not a calendar year.
Electricity Imports and Exports
Balance of Trade
* 12M = Last 12 months (Jul 2025 – Jun 2026) — a rolling 12-month period, not a calendar year.
Nearby Regions