From July 2025 through June 2026, almost two-thirds of Michigan’s electricity consumption came from fossil sources, while just over a third came from low-carbon sources. Gas supplied about 45% of electricity, coal about 19%, and oil about 1%. Nuclear was the largest clean electricity source, providing 21%, followed by wind at about 8%, solar at just over 3%, and biofuels at nearly 2%. Utility-scale installations supplied most of Michigan’s solar electricity. This mix leaves substantial scope to expand clean electricity and reduce the climate change and air pollution associated with fossil fuels.
Is Electricity Growing in Michigan?
Michigan’s electricity consumption is not currently growing on a per-person basis. The latest 2026 figure was about 12,390 kWh per person, roughly 280 kWh—or 2%—below the record of about 12,670 kWh set in 2025. Low-carbon electricity generation also slipped slightly, reaching about 4,290 kWh per person, around 24 kWh below its 2025 record. These declines are disappointing: Michigan needs growing supplies of clean electricity to support electrification and rising demand from AI and other industries. However, per-person figures alone do not establish whether statewide electricity consumption increased or decreased.
Suggestions
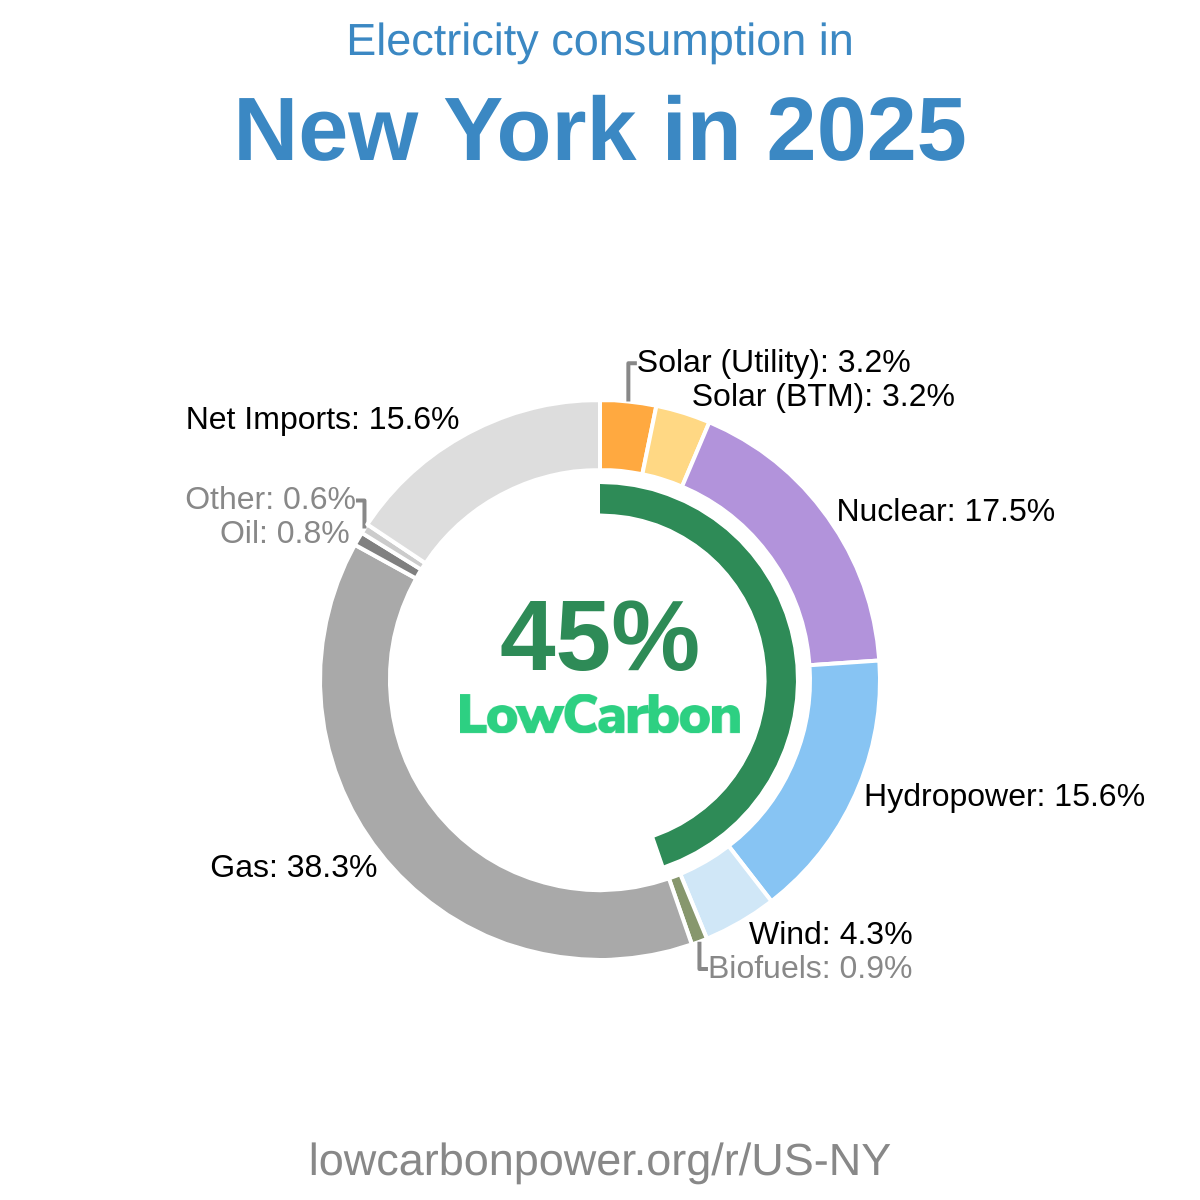
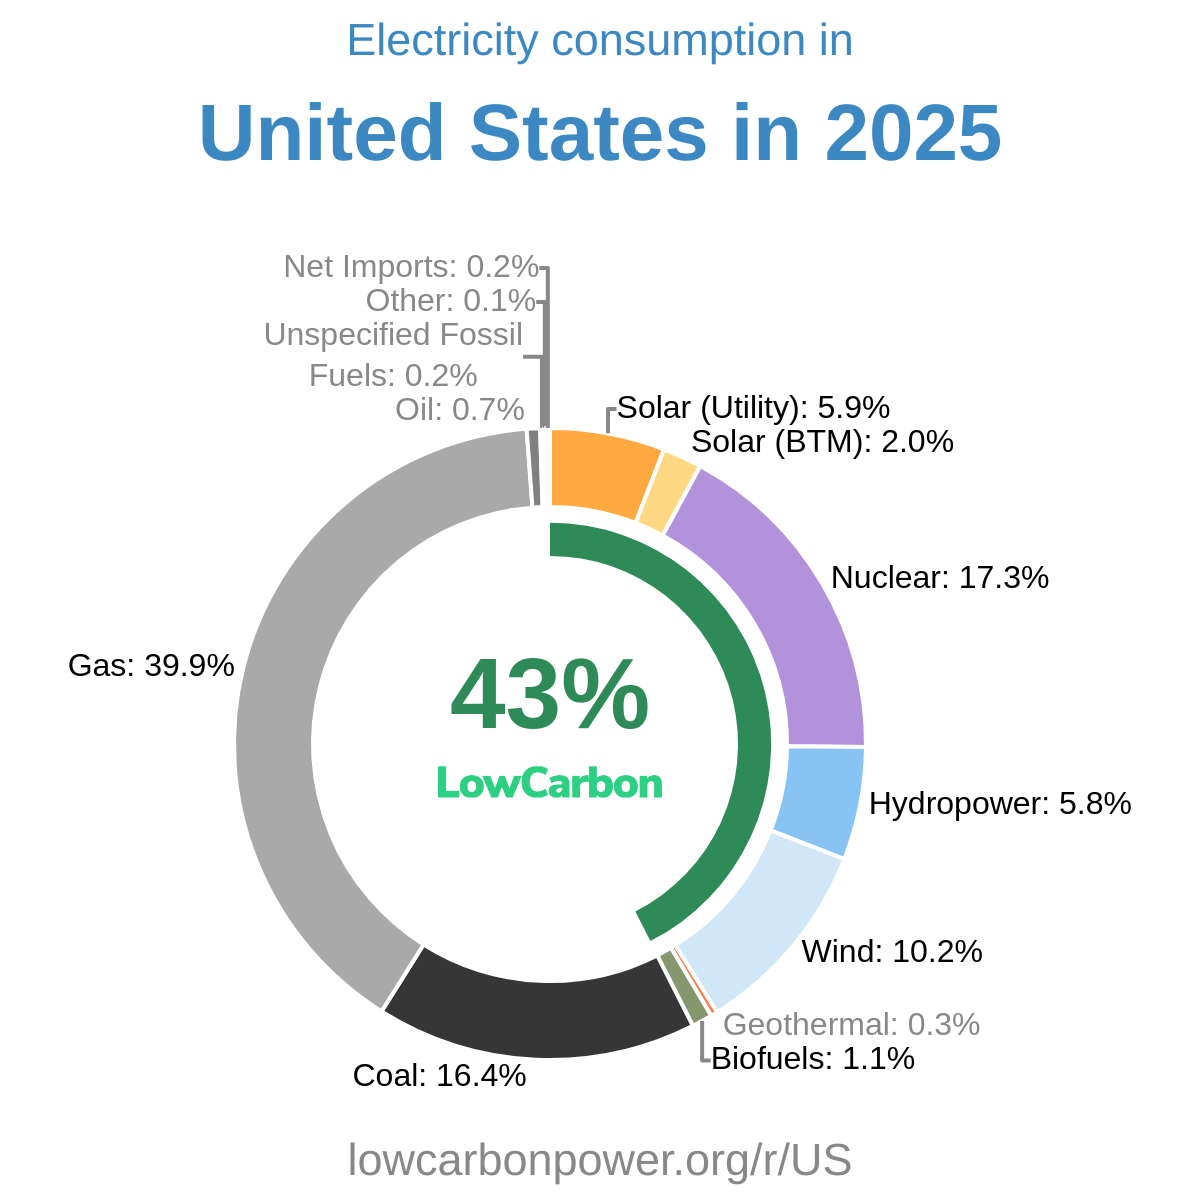
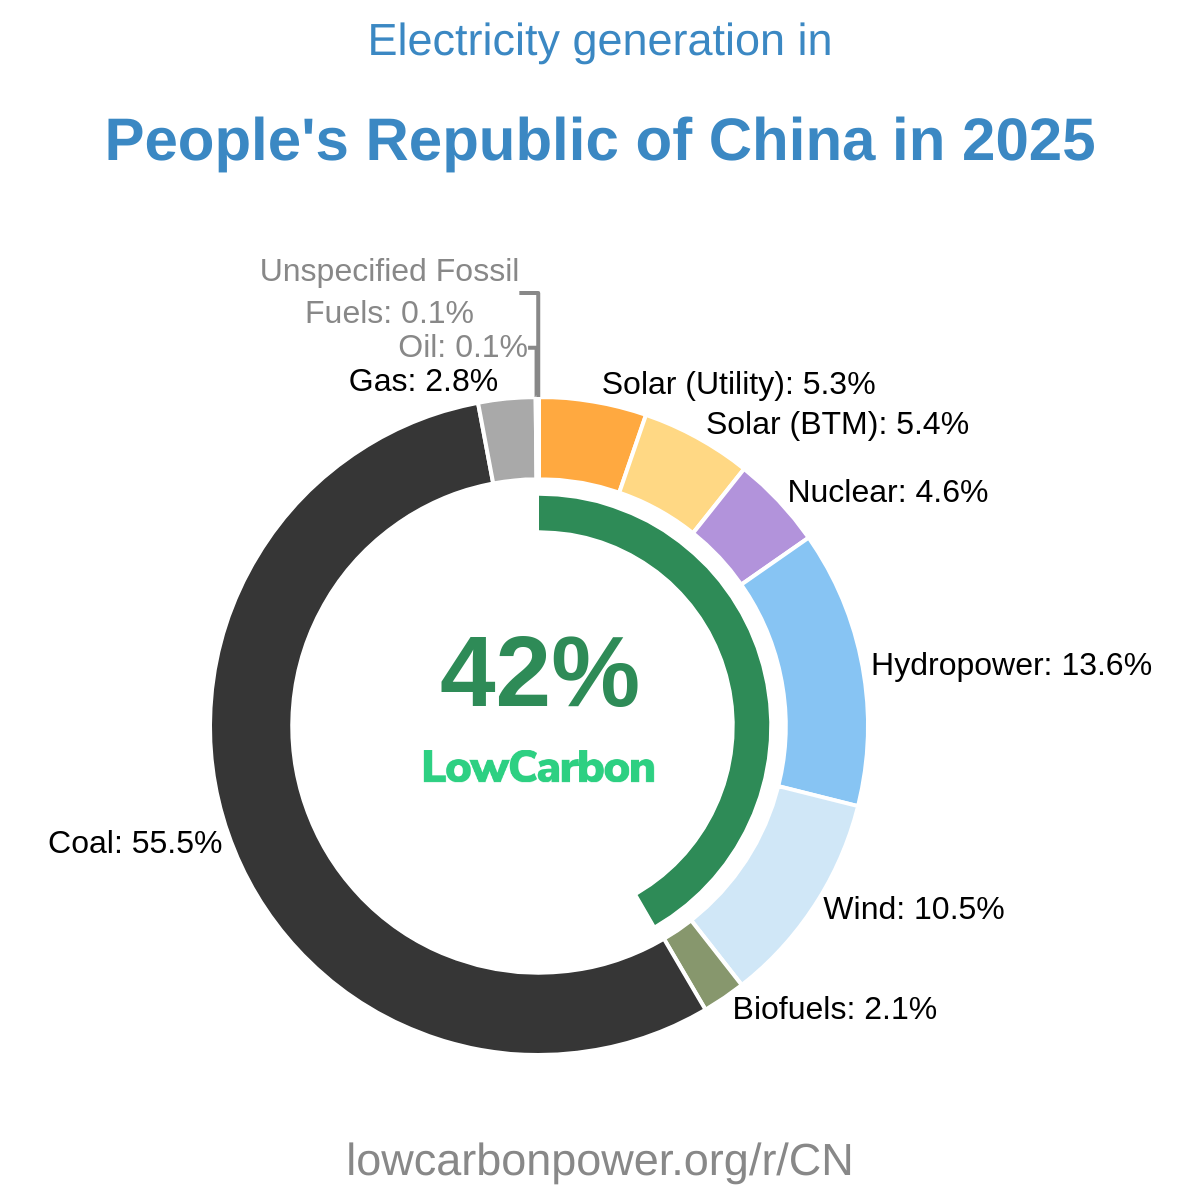
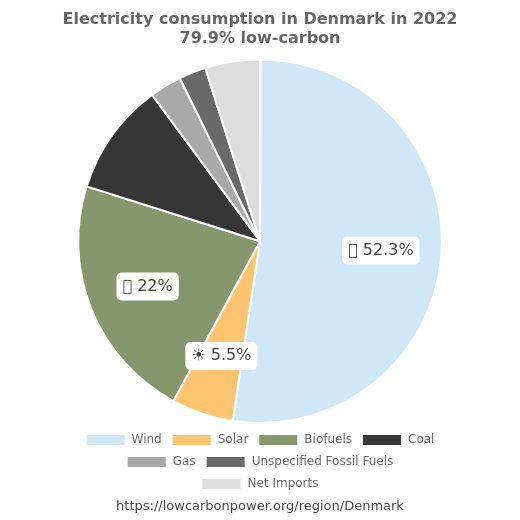
Michigan should expand its existing nuclear generation where feasible, consider additional nuclear capacity, and accelerate solar and wind development. Nearby Illinois offers a particularly relevant example: nuclear supplies almost half of electricity generation in that US state, compared with about a fifth in Michigan. France, where nuclear supplies about two-thirds, also demonstrates the technology’s potential to anchor a low-carbon electricity system. For wind, Michigan can learn from the US states of Iowa and Minnesota, where wind supplies about 57% and 21% of electricity generation, respectively. Solar deserves a larger role too: Germany generates about 20% of its electricity from solar, showing that substantial solar contributions are achievable beyond the sunniest regions. Investment in transmission, grid connections, and storage would help Michigan accommodate more clean generation.
* 12M = Last 12 months (Jul 2025 – Jun 2026) — a rolling 12-month period, not a calendar year.
History
Across 2024–2026, Michigan’s low-carbon electricity history shows uneven progress rather than sustained growth. Nuclear generation fell by 1.7 TWh in 2024, recovered by 1.3 TWh in 2025, and fell again by 1.1 TWh in 2026—a disappointing net loss of 1.5 TWh across the three years. Preserving and expanding this major source of clean electricity should be a priority. Wind generation increased by 1.5 TWh in 2024 and another 0.3 TWh in 2025 before slipping by 0.3 TWh in 2026, leaving a net gain of 1.5 TWh. Hydro declined by 0.3 TWh in 2024, then increased by 0.3 TWh in each of the following two years. Biofuel generation changed only modestly, falling by 0.1 TWh in 2024, rising by 0.2 TWh in 2025, and remaining unchanged in 2026. Overall, these fluctuations underline the need for sustained nuclear, solar, and wind expansion rather than gains that merely offset losses elsewhere.
* 12M = Last 12 months (Jul 2025 – Jun 2026) — a rolling 12-month period, not a calendar year.
Electricity Imports and Exports
Balance of Trade
* 12M = Last 12 months (Jul 2025 – Jun 2026) — a rolling 12-month period, not a calendar year.
Nearby Regions


.png)