

From July 2025 through June 2026, Maryland relied on net electricity imports for about 39% of its electricity consumption. In-state low-carbon generation supplied roughly 31%, while fossil generation supplied about 29%. Nuclear was the largest clean electricity source, providing 22% of consumption, followed by solar at about 5%, hydropower at 2%, and wind at 1%. Solar’s contribution was split almost evenly between behind-the-meter systems and utility-scale installations. Gas supplied about 24% of consumption, coal 4%, and oil 1%. The imports’ generation mix is not specified, so they cannot be classified as either clean or fossil electricity from these figures alone.
Is Electricity Growing in Maryland?
Maryland’s electricity consumption is growing modestly on a per-person basis. The latest 2026 figure reached about 10,736 kWh per person, exceeding the 2025 record of 10,665 kWh by 71 kWh, or roughly 0.7%. Low-carbon electricity generation grew faster, reaching 3,342 kWh per person—94 kWh, or about 3%, above its previous record in 2025. These are encouraging new highs, especially for clean electricity, although stronger growth would help meet additional demand from electrification and AI. These per-person figures alone do not establish how much statewide total consumption increased.
Suggestions
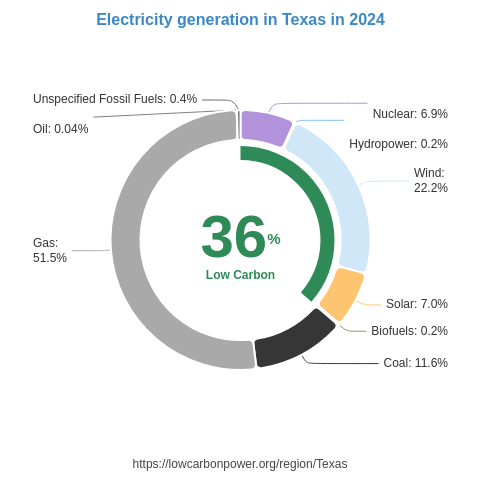
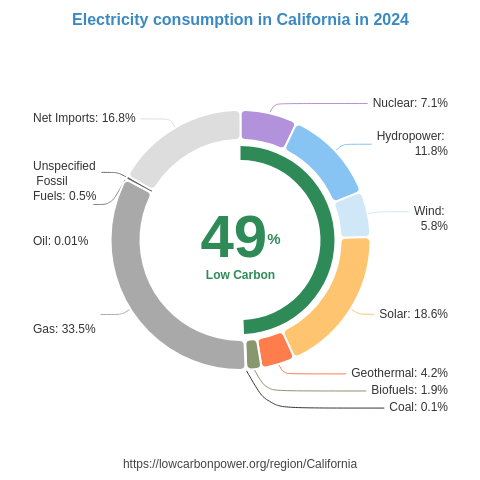
Maryland can increase clean electricity generation by expanding output from its existing nuclear facilities and accelerating both rooftop and utility-scale solar development. Nearby examples offer useful lessons: nuclear supplies about a third of electricity generation in the US state of New Jersey and 36% in the US state of Connecticut, while the US state of South Carolina gets more than half from nuclear. France, at about 67%, also demonstrates nuclear’s potential as a foundation for low-carbon electricity. For solar, the US state of Maine’s 18% share offers a useful example beyond the sunniest regions, while the US state of California generates almost a third of its electricity from solar. Maryland can also learn from wind development in the United Kingdom, where wind supplies about 30% of generation. Together, nuclear expansion, solar deployment, and suitable wind projects could increase local clean electricity supplies and reduce reliance on fossil generation and its associated climate and air-pollution impacts.
* 12M = Last 12 months (Jul 2025 – Jun 2026) — a rolling 12-month period, not a calendar year.
History
The supplied history covers 2024 through 2026 and shows modest, uneven changes in Maryland’s low-carbon electricity generation. Nuclear generation fell by 0.3 TWh in 2024, then recovered by 0.1 TWh in each of 2025 and 2026, leaving output slightly below its 2023 level. Wind delivered steady gains of 0.1 TWh in each of the three years. Hydropower was unchanged in 2024 before declining by 0.3 TWh in 2025 and another 0.2 TWh in 2026, a disappointing loss of clean electricity output. Biofuels generation remained unchanged throughout. Overall, the listed sources show why Maryland needs sustained growth in nuclear, solar, and other low-carbon electricity to build on its latest progress.
* 12M = Last 12 months (Jul 2025 – Jun 2026) — a rolling 12-month period, not a calendar year.
Electricity Imports and Exports
Balance of Trade
* 12M = Last 12 months (Jul 2025 – Jun 2026) — a rolling 12-month period, not a calendar year.
Nearby Regions