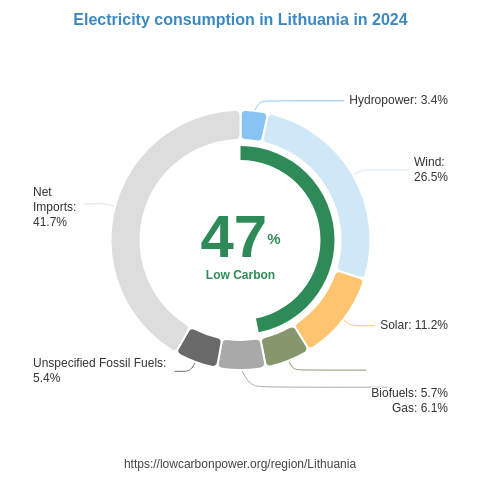
Over the past year, from June 2025 to May 2026, Estonia's electricity consumption has depicted a fascinating distribution among different energy sources. Net imports account for a little more than 40% of the total electricity usage, indicating a significant reliance on external sources. Low-carbon energies, which include wind, solar, and biofuels, contribute approximately 41% of the electricity mix, showcasing Estonia's commitment to green energy. Within this category, wind energy represents around 15%, solar accounts for nearly 13%, and biofuels furnish close to 12%. On the other hand, fossil fuels cover almost 18% of the electricity consumption, highlighting space for improvement in reducing carbon footprints and moving towards a more sustainable future.
Is Electricity Growing in Estonia?
When evaluating the growth of electricity consumption in Estonia, current indicators underscore a concerning trend. The latest electricity consumption rate is 6152 kWh per person, which is noticeably less than the historical high of 11690 kWh per person recorded in 1986, amounting to a reduction of around 5540 kWh per person. This drop can potentially restrain electrification and innovation. Furthermore, low-carbon electricity generation also saw a minor decline, with current figures at 2493 kWh per person, a slight decrease from the previous year. This decreasing trend is a cause for worry as Estonia seeks to meet growing energy needs and climate goals through cleaner electricity options.
Suggestions
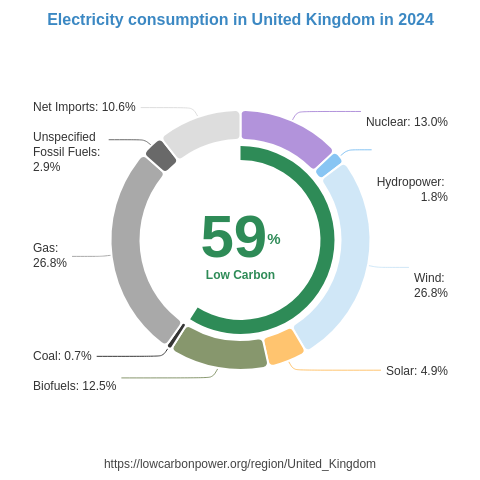
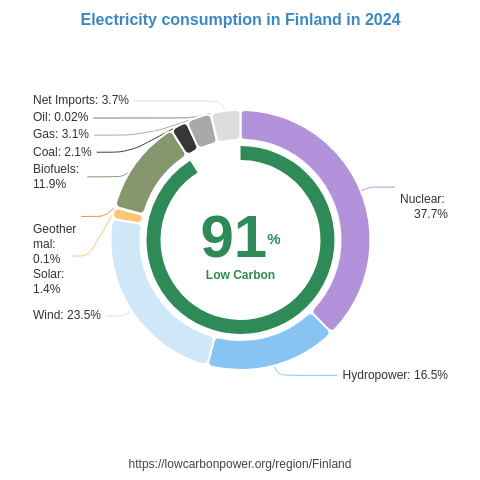
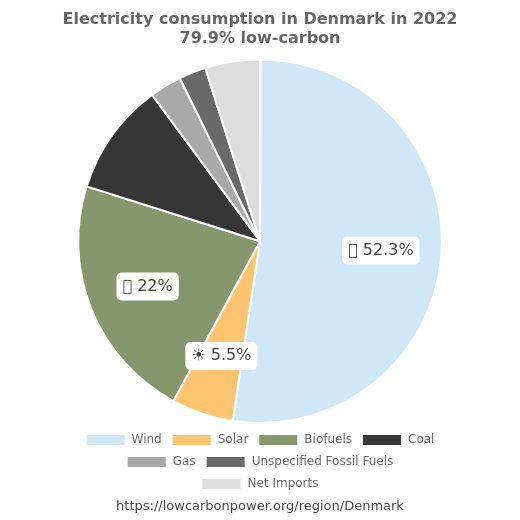
To bolster its low-carbon electricity generation, Estonia can expand its current wind and solar resources significantly, given their already substantial contribution to the energy mix. Observing leading regions, Estonia could take inspiration from Denmark and Iowa, where wind energy provides a substantial share of electricity, constituting 60% and 57% respectively. Additionally, exploring nuclear energy as a long-term solution could be beneficial, drawing lessons from France and Slovakia, where nuclear power covers a whopping 67% and 65% of electricity demands. Investing in these cleaner and more sustainable technologies not only minimizes reliance on imports and fossil fuels but also solidifies energy security.
* 12M = Last 12 months (Jun 2025 – May 2026) — a rolling 12-month period, not a calendar year.
History
Historically, Estonia's low-carbon energy landscapes have varied across different years. The early 2000s witnessed a consistent rise in biofuels, with 2009 and 2010 marking notable increases of 0.3 and 0.4 TWh, respectively. In the mid-2010s, wind energy experienced minor fluctuations, with a temporary decline in 2016 but rebounding with a positive trajectory in subsequent years. The 2020s ushered in a remarkable upsurge in solar and wind energies, marking 0.4 TWh growth in 2024, illustrating Estonia's positive strides towards enhancing low-carbon electricity generation. Although the recent minor decrease in biofuels hints at a need for diversification and emphasis on other low-carbon sources, Estonia's historical path reflects a steady commitment to sustainable energy practices.
* 12M = Last 12 months (Jun 2025 – May 2026) — a rolling 12-month period, not a calendar year.
Electricity Imports and Exports
Balance of Trade
* 12M = Last 12 months (Jun 2025 – May 2026) — a rolling 12-month period, not a calendar year.
Nearby Regions