Georgia, US, has a varied mix of electricity generation sources. Over the 12-month period from July 2025 to June 2026, fossil fuels were slightly over 46% of the electricity, with gas being the dominant fossil fuel at almost 34%, while coal contributed about 12%. On the clean side, low-carbon sources accounted for over 40% of the electricity share, with nuclear energy generating about 30%, making it a significant contributor to the state's low-carbon efforts. Solar energy, though important, contributed just a small share, with utility-scale solar comprising nearly 7% of the total electricity. Biofuels added a minor proportion of approximately 3%. Net imports from neighboring regions also played a role, making up roughly 13% of Georgia’s electricity. The current energy landscape reflects a considerable reliance on fossil fuels, but a strong foundation for low-carbon electricity is present through nuclear energy and solar.
Is Electricity Growing in Georgia (US)?
In terms of growth, Georgia’s latest electricity consumption figures show a modest increase, with 2026 recording 15,040 kWh per person, a rise of 89 kWh per person compared to the previous record in 2025. This mild growth shows encouraging steps, but there remains much room for improvement to support electrification and future energy demands. Worryingly, low-carbon electricity generation per capita saw a decline from the high of 6,196 kWh per person in 2025 to 6,104 kWh per person in 2026, showing a drop of 92 kWh. Despite the small dip, there is still a vibrant potential to scale clean electricity sources particularly given the existing significant contributions from nuclear power.
Suggestions
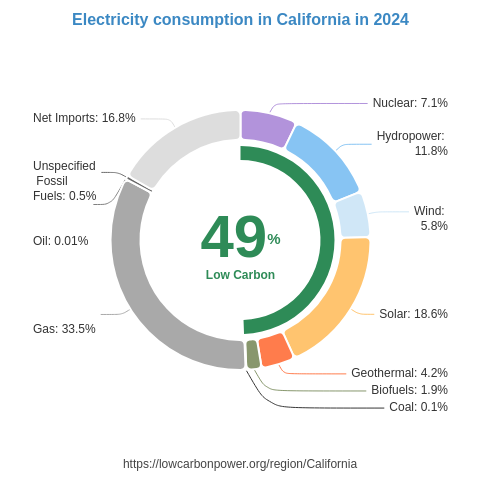
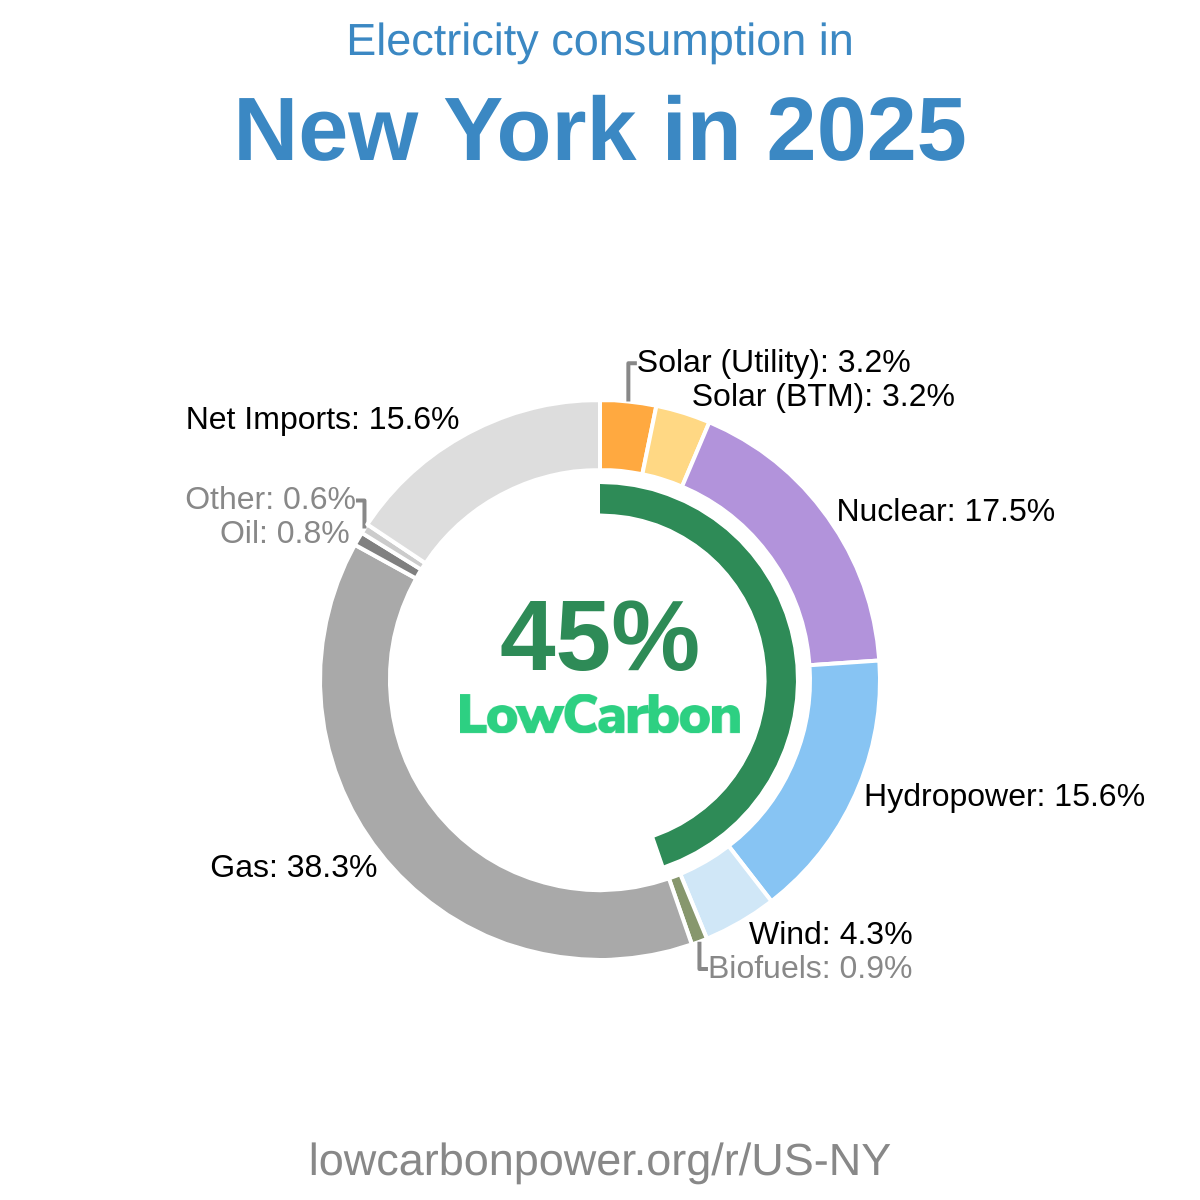
In light of the current challenges and opportunities, Georgia can focus on expanding its nuclear capacity, already a major contributor to its low-carbon electricity generation. The state can take inspiration from regions like France, where nuclear energy provides an impressive 67% of electricity, and from South Carolina, another US state where nuclear makes up over half of total electricity generation. Additionally, Georgia could increase its solar capacity by learning from California and Nevada, where solar accounts for 31% and 35% of electricity, respectively. By leveraging these insights, Georgia can better harness its solar potential alongside nuclear for a robust clean energy future.
* 12M = Last 12 months (Jul 2025 – Jun 2026) — a rolling 12-month period, not a calendar year.
History
Looking at the history of low-carbon electricity generation in Georgia, the recent years paint a picture of fluctuating fortunes. In 2024, the state witnessed a significant rise in nuclear electricity generation, with an impressive increase of 10.6 TWh, complemented by a modest increase in biofuels. This growth continued in 2025, albeit at a reduced pace, with nuclear generation rising by 3.2 TWh despite a slight drop in biofuels. In an unfortunate turn in 2026, there were slight decreases across nuclear, biofuels, and hydro, representing a stall in the progress of clean energy expansion. It is crucial for Georgia to address these fluctuations and maintain a steady increase in clean, sustainable electricity generation for the future.
* 12M = Last 12 months (Jul 2025 – Jun 2026) — a rolling 12-month period, not a calendar year.
Electricity Imports and Exports
Balance of Trade
* 12M = Last 12 months (Jul 2025 – Jun 2026) — a rolling 12-month period, not a calendar year.
Nearby Regions