Electricity in Togo in 2023
In 2023, Togo relies significantly on net imports for its electricity needs, bringing in about 1.1 TWh from outside sources. The local per capita electricity consumption stands at 217 kWh, which is quite low compared to the global average of 3771 kWh per person. Electricity generated from low-carbon sources in Togo is notably limited, accounting for only 20 kWh per person. This contrasts starkly with the substantial reliance on fossil energy for electricity, prompting concerns about climate impacts and air pollution. Low electricity consumption can hinder economic development, restrict improvements in living standards, and limit access to technology essential for modern living.
Is Electricity Growing in Togo?
In recent years, electricity consumption in Togo has not displayed positive growth trends. The current figure of 217 kWh per person represents a decline from the 224 kWh per person recorded in 2014. This decrease of 7 kWh per person is a potential cause for concern, as it indicates a stagnation rather than an increase in electricity generation. Similarly, low-carbon electricity generation has decreased drastically from its peak in 1995, dropping from 58 to 20 kWh per person, marking a significant decline of 37 kWh per person. Such a reduction in clean energy use raises questions about the country's energy strategy and its preparedness to transition to sustainable electricity sources.
Suggestions
To enhance its electricity generation, especially from low-carbon sources, Togo can learn from other regions that have excelled in this domain. Nations like China and India have made remarkable strides in solar energy, generating 1213 TWh and 182 TWh respectively. Emulating these efforts by investing in solar technologies could be beneficial for Togo, which has ample sunlight. Furthermore, adopting nuclear energy seen in countries such as France and South Korea, which generate 379 TWh and 165 TWh respectively, could offer a stable, low-carbon energy source. Togo should aim to harness these clean technologies to reduce dependence on fossil fuels and improve both its energy security and environmental footprint.
History
Historically, Togo's low-carbon electricity generation has primarily relied on hydroelectricity, but it has faced fluctuations over the years, often marked by marginal increases or decreases in output. In the 1990s, hydroelectric generation saw minor ups and downs, with years like 1990 and 1991 witnessing slight increases before falling back every other year. By the early 21st century, hydroelectric development largely stagnated, and disruptions persisted into the mid to late 2010s with similarly minor changes, indicating a lack of strong growth or development. It was not until 2021 that solar energy made a small entry, pointing towards a potentially promising avenue for expansion. The historical pattern highlights the need for a robust and forward-looking strategy focusing on sustainable electricity generation to meet the country's needs and align with global trends favoring clean energy development.
Electricity Imports and Exports
Balance of Trade
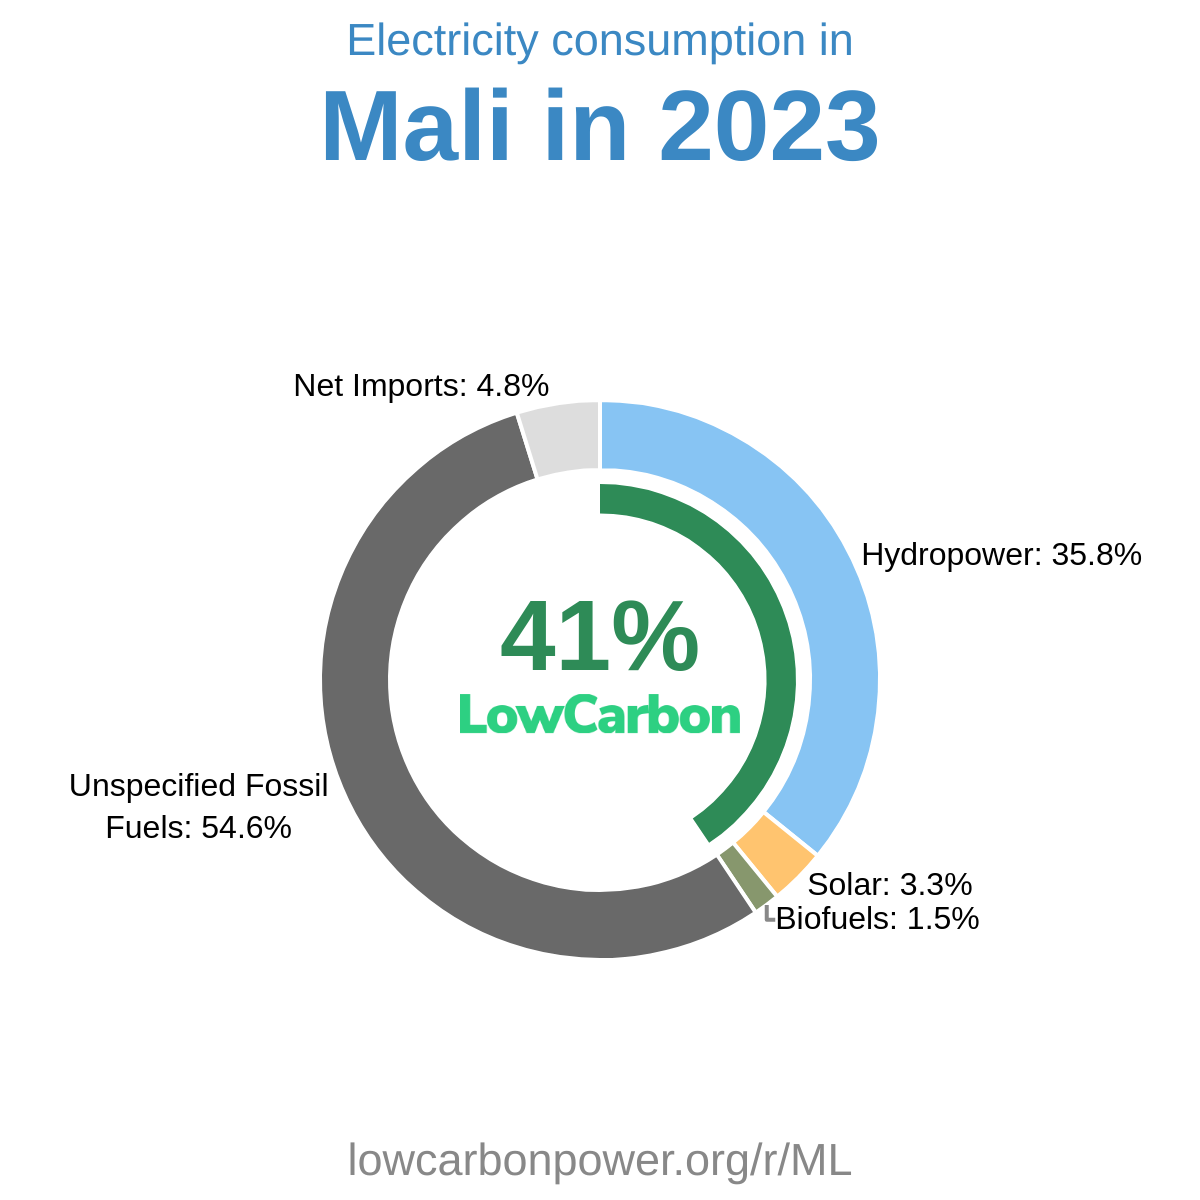
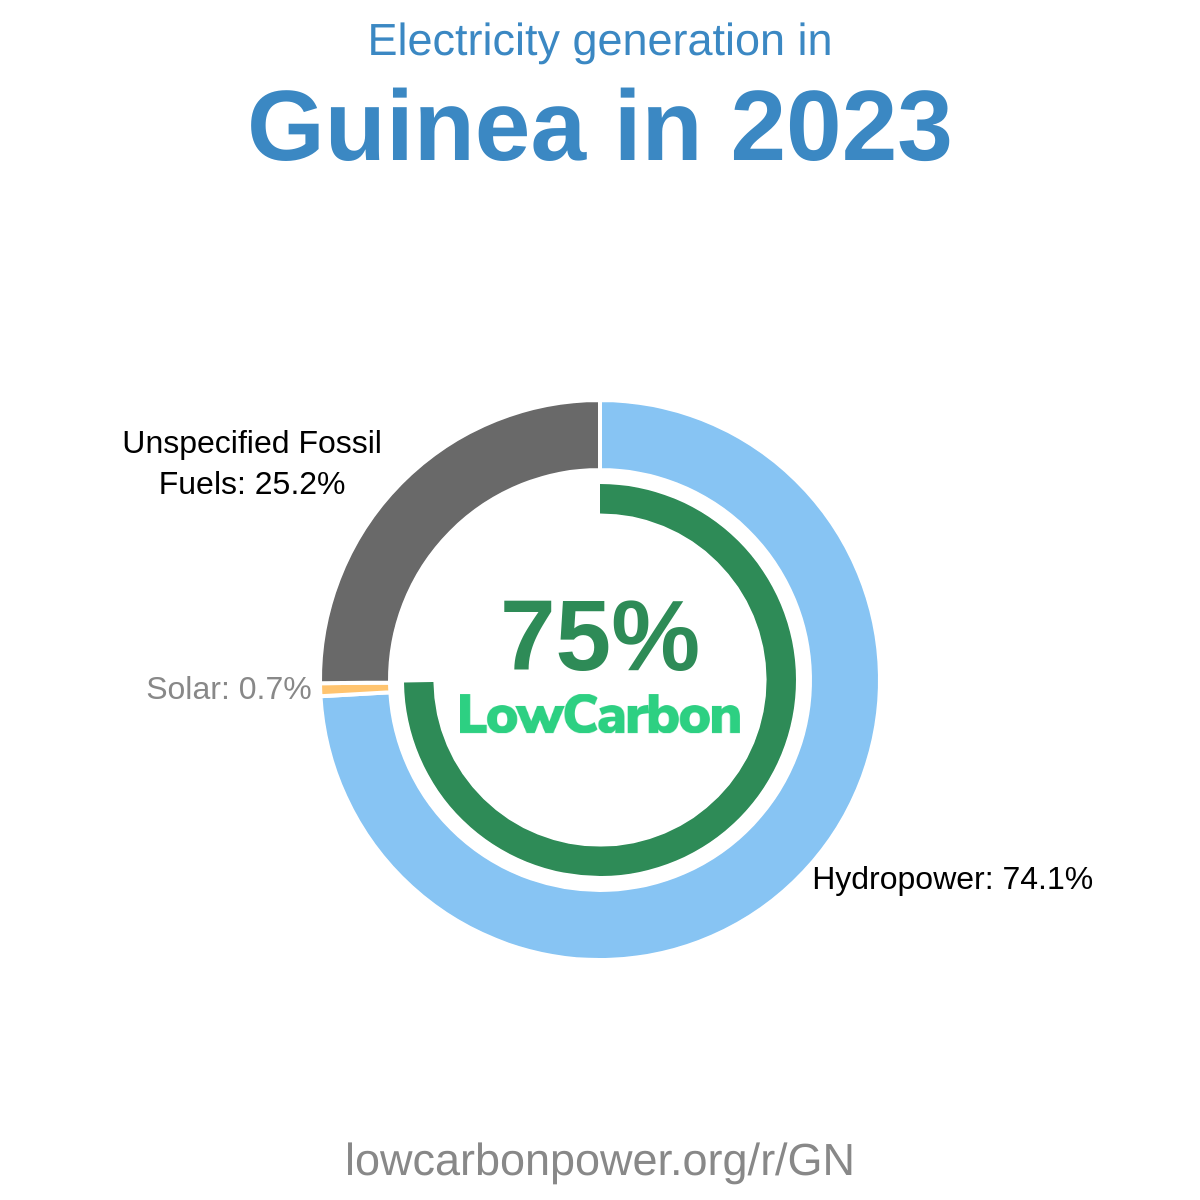
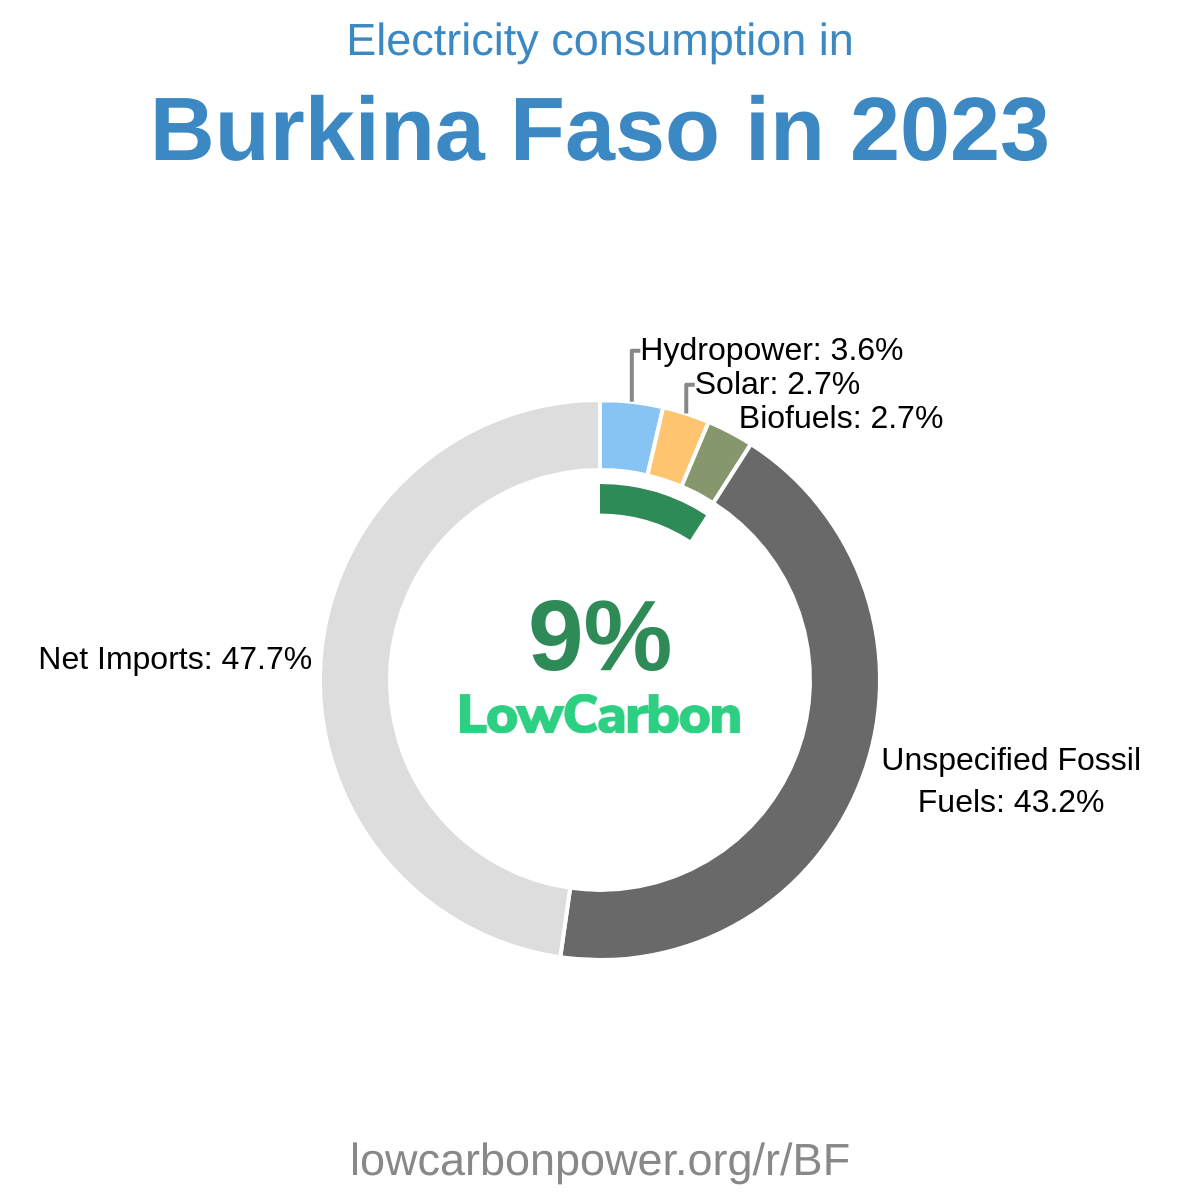
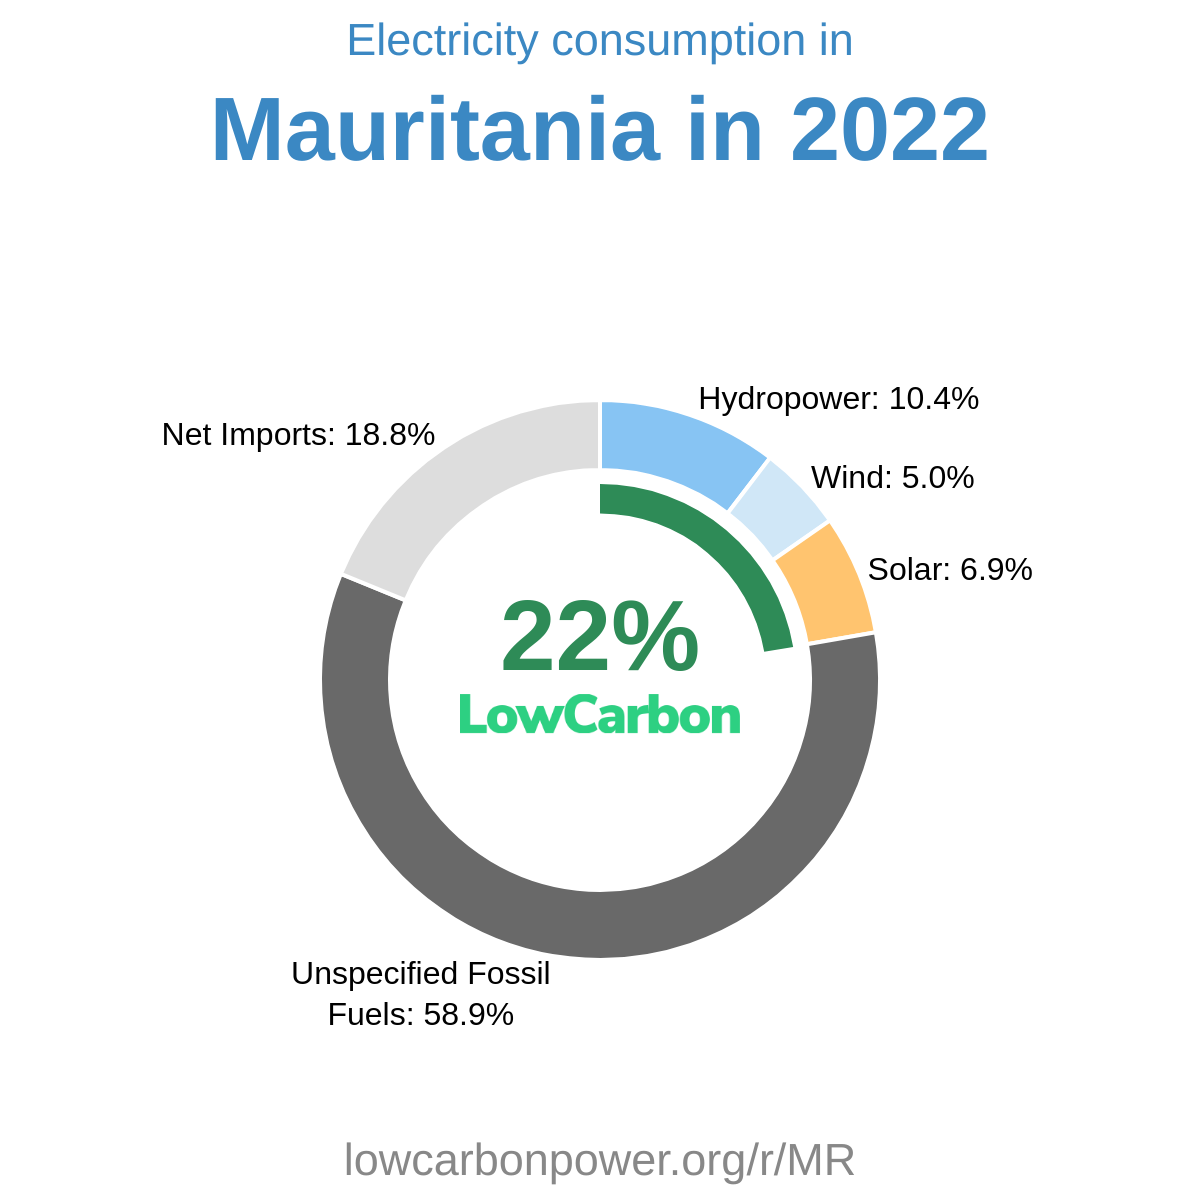
Nearby Regions