

In 2022, about two-thirds of French Polynesia’s electricity came from fossil fuels, while roughly one-third came from low-carbon sources. Hydropower supplied around 27% of electricity and solar another 7%. Clean electricity therefore already made a meaningful contribution, but fossil fuels remained dominant. Expanding low-carbon generation would help reduce the climate impacts and air pollution associated with fossil-fuel use.
Is Electricity Growing in French Polynesia?
French Polynesia’s electricity consumption per person was below its historical peak in 2022, rather than setting a new growth record. Consumption stood at about 2,530 kWh per person, down 387 kWh, or roughly 13%, from the 2010 record of 2,920 kWh. Low-carbon electricity generation was also below its peak: about 860 kWh per person, compared with nearly 1,000 kWh in 2010—a decline of 142 kWh, or around 14%. These shortfalls are concerning as more clean electricity will be needed to support electrification and future demand, although comparing two record-year figures alone does not establish the recent year-to-year trend.
Suggestions
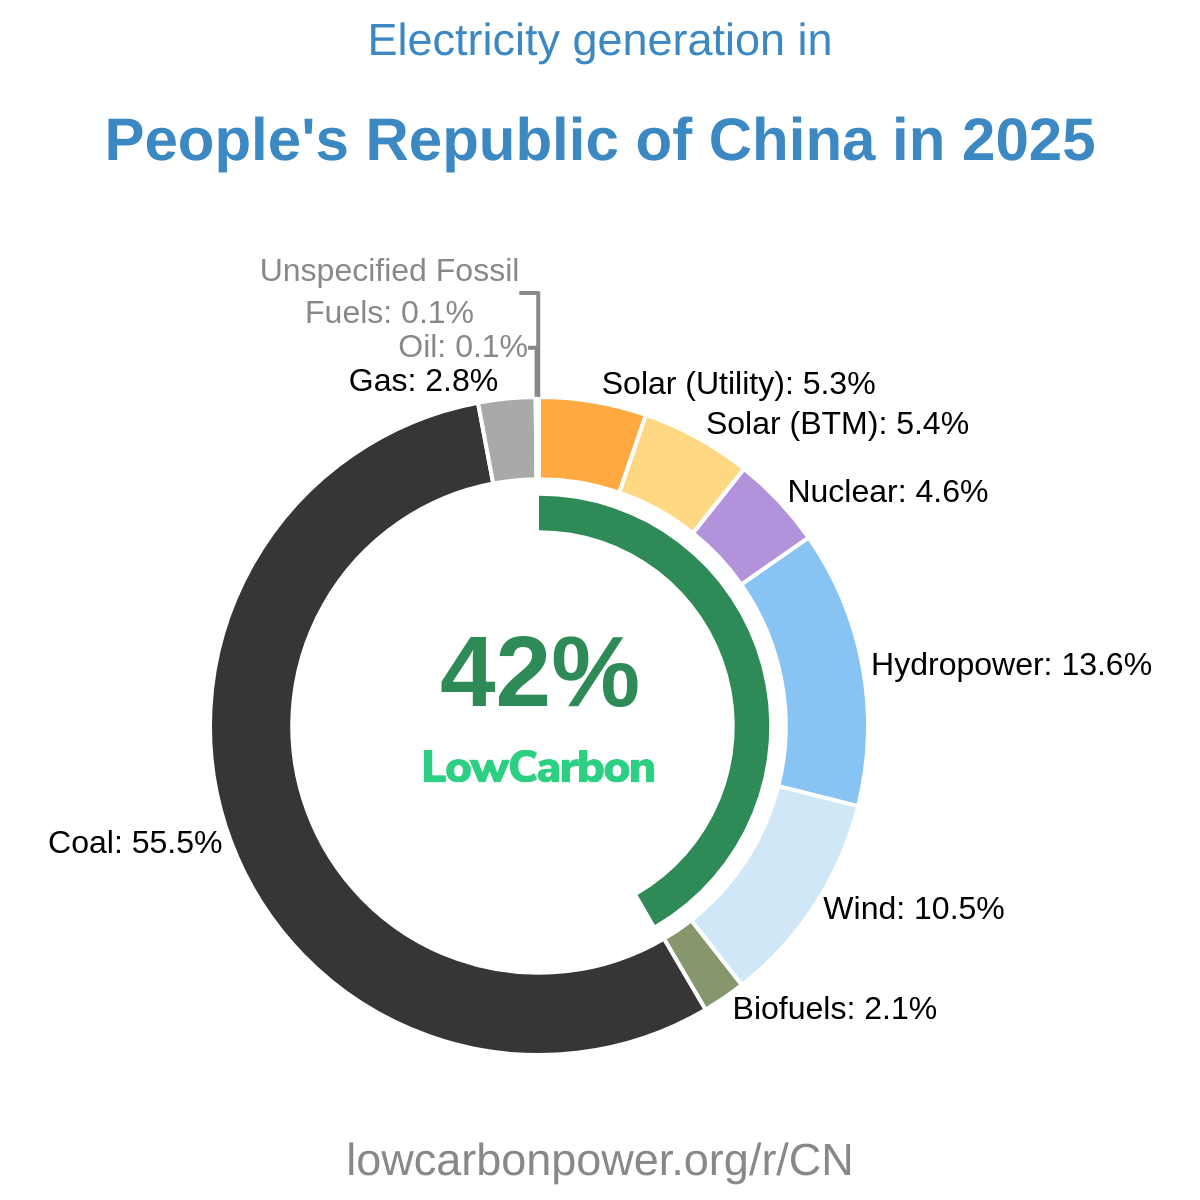
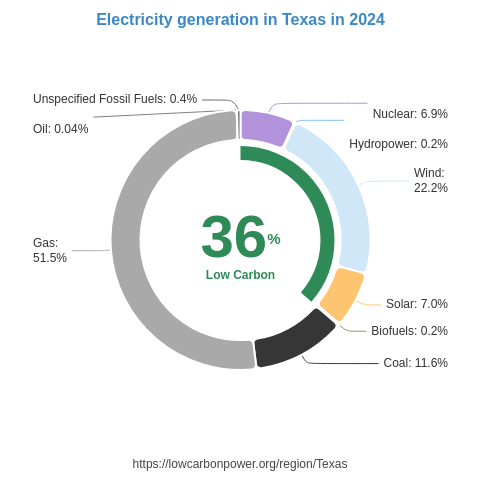
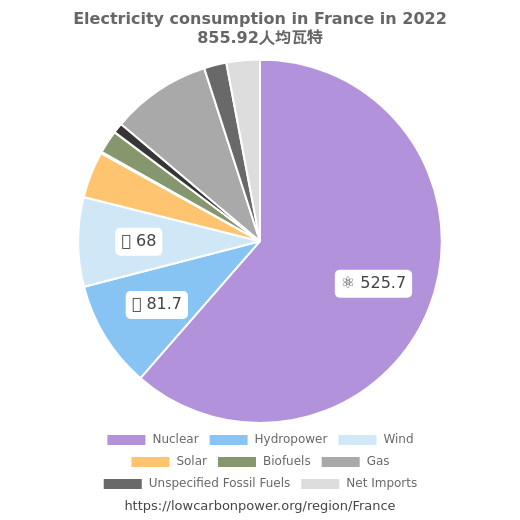
To increase low-carbon electricity generation, French Polynesia should prioritize expanding solar, supported by storage and grid improvements. The US state of Hawaii offers a particularly relevant island comparison, with solar supplying 23% of its electricity; Cyprus also reaches 23%, well above French Polynesia’s 7%. Cape Verde, another island setting, generates 14% of its electricity from wind, suggesting that locally suitable wind projects also deserve investigation. Nuclear should be included in long-term clean-electricity planning and cooperation with France, where it supplies about two-thirds of electricity. French Polynesia could draw on French nuclear expertise and assess options suited to its electricity system, while advancing solar deployment now.
History
The reported history shows little change in hydropower generation during the listed years of the 2000s, followed by larger movements in the early 2010s. Hydropower increased by 0.1 TWh in 2010, fell by the same amount in 2011, and declined by another 0.1 TWh in 2013. The later listed hydropower entries, through 2022, show no change at the data’s reporting precision. Solar likewise recorded no reported annual change in the listed years between 2011 and 2021; these rounded figures do not mean solar generation was absent or that smaller increases did not occur. Overall, the record highlights the need for a stronger, sustained expansion of clean electricity.
Electricity Imports and Exports
Balance of Trade
Nearby Regions