

In 2022, Jordan relied on fossil fuels for more than three-quarters of its electricity, with gas alone supplying almost 73%. Low-carbon sources provided about 23%, led by solar at roughly 15% and wind at nearly 8%. Clean electricity therefore supplied almost a quarter of consumption, but fossil fuels still dominated, leaving substantial scope for solar, wind and nuclear to help reduce climate-changing emissions and air pollution.
Is Electricity Growing in Jordan?
Jordan’s electricity consumption per person remained below its historical peak in 2022. Consumption reached about 2,010 kWh per person, around 265 kWh—or 12%—below the 2012 record of 2,276 kWh. This shortfall is concerning as electrification and growing digital demand will require more electricity, although these figures alone do not establish whether total national consumption declined. Encouragingly, low-carbon electricity generation reached a new record of 464 kWh per person, up 20 kWh, or about 5%, from the previous record in 2021.
Suggestions
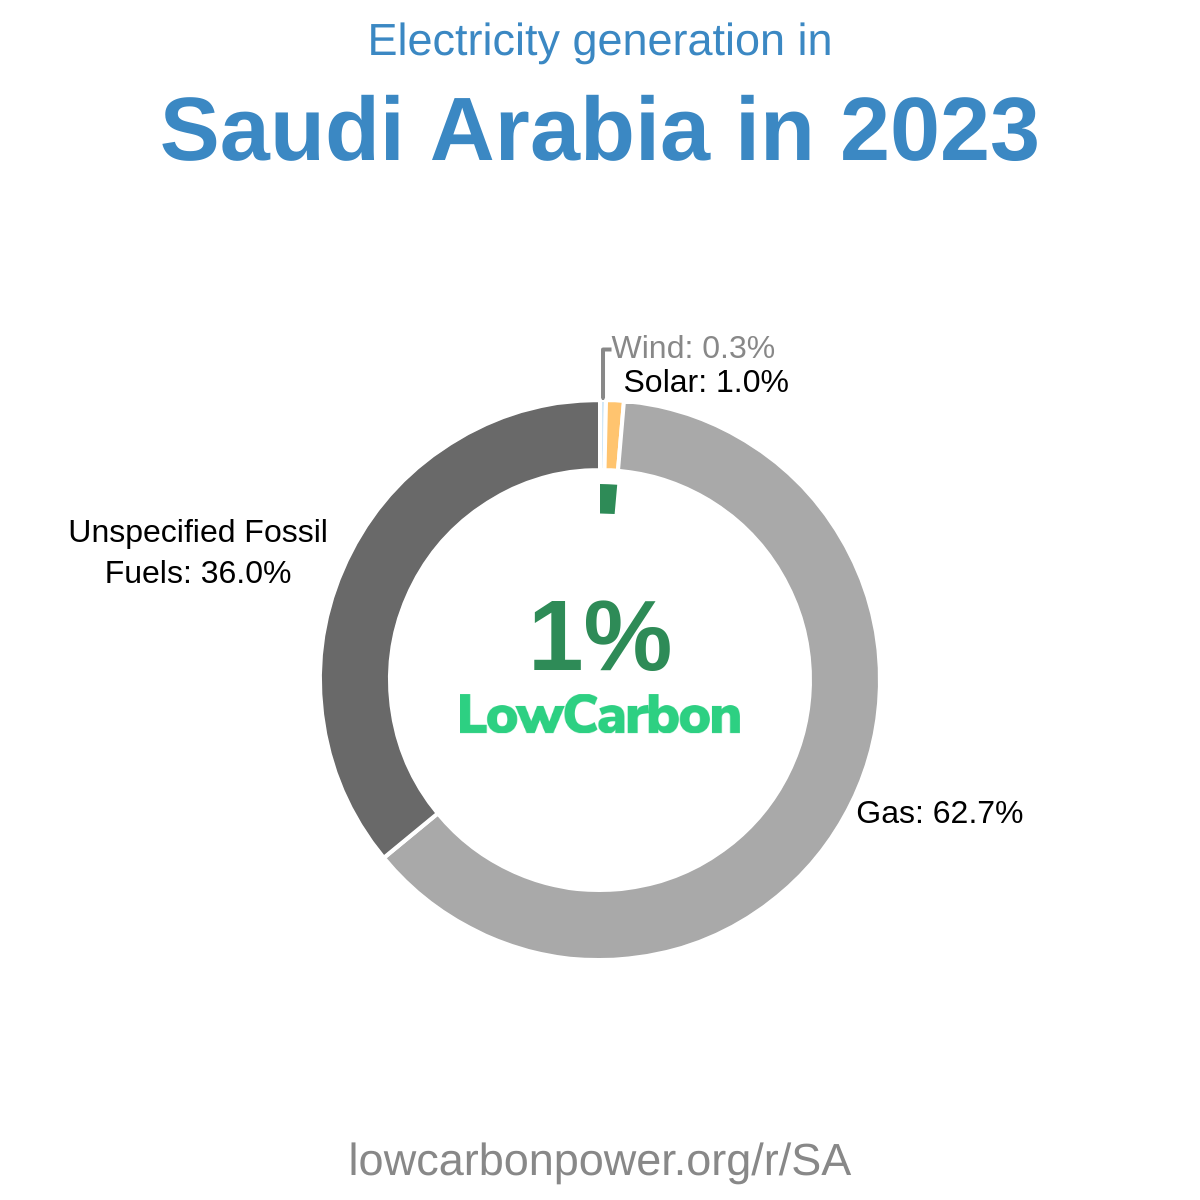
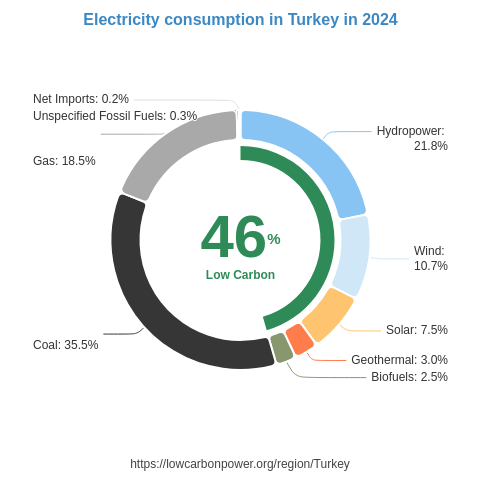
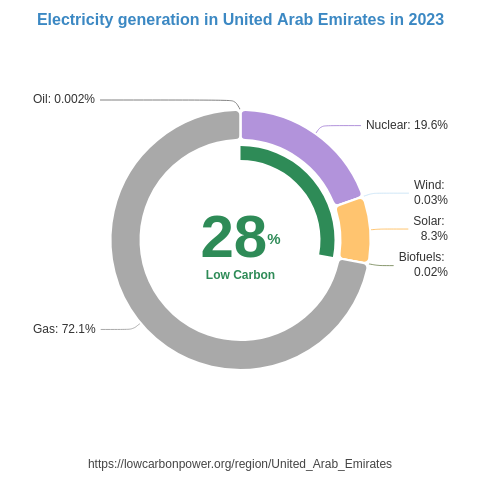
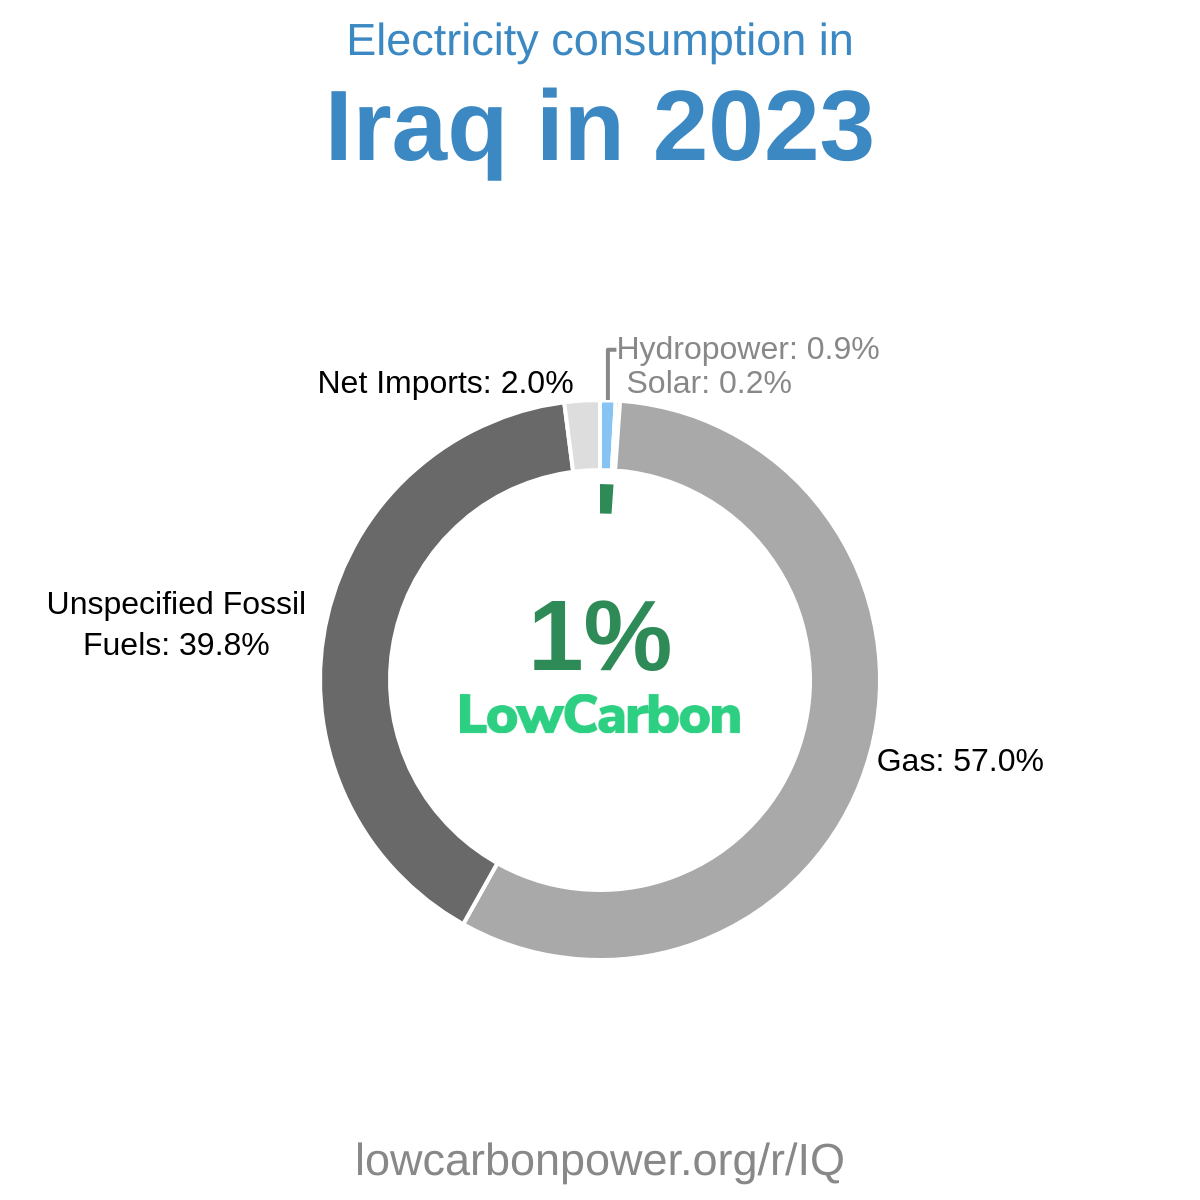
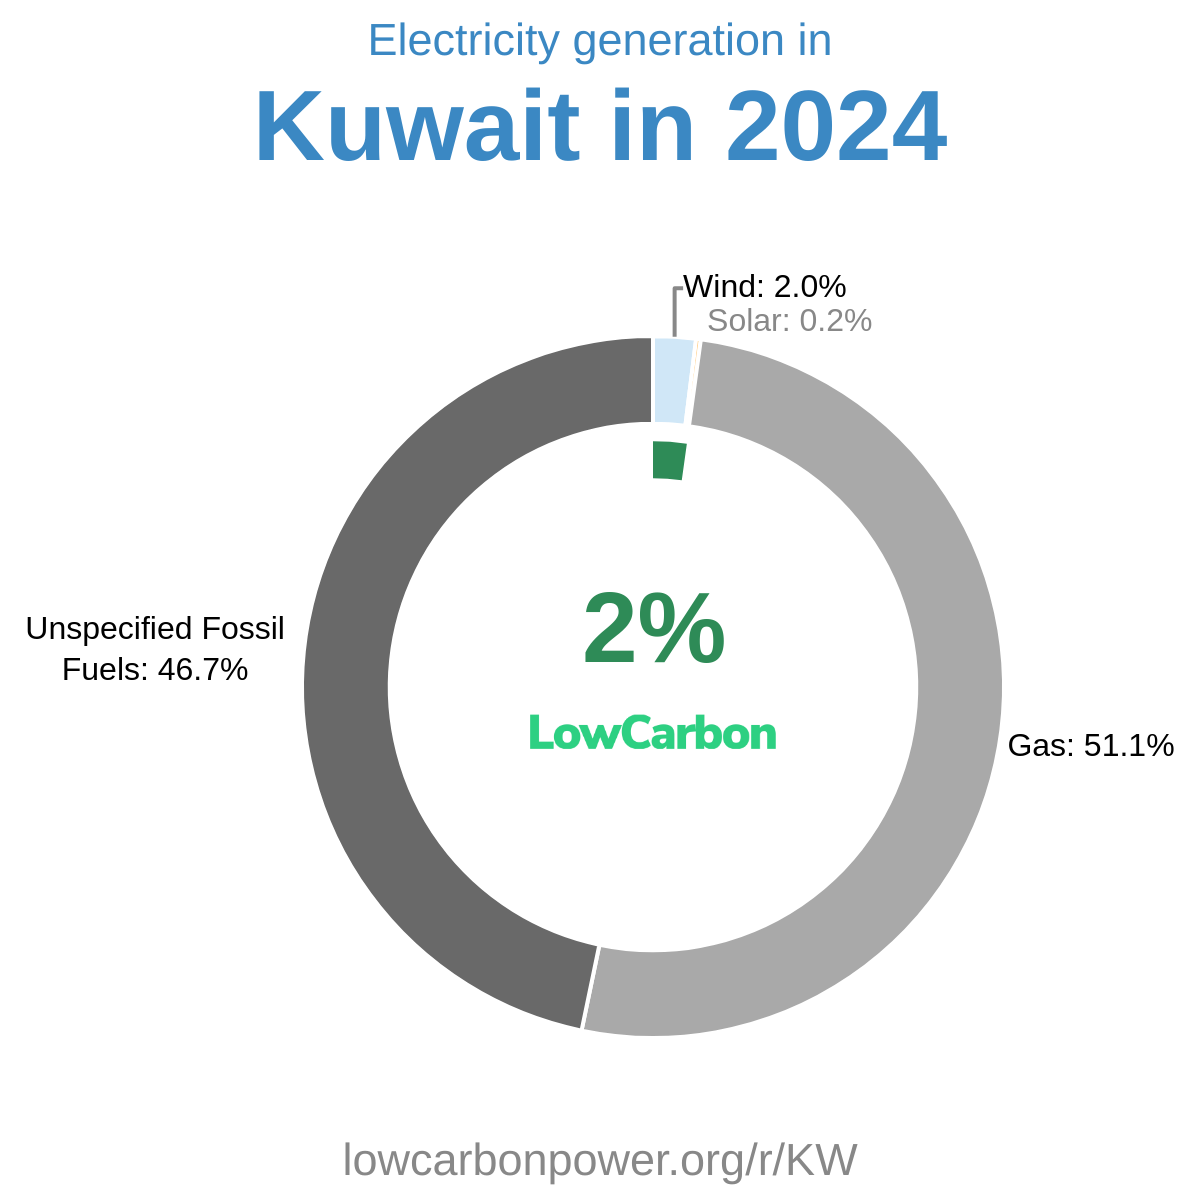
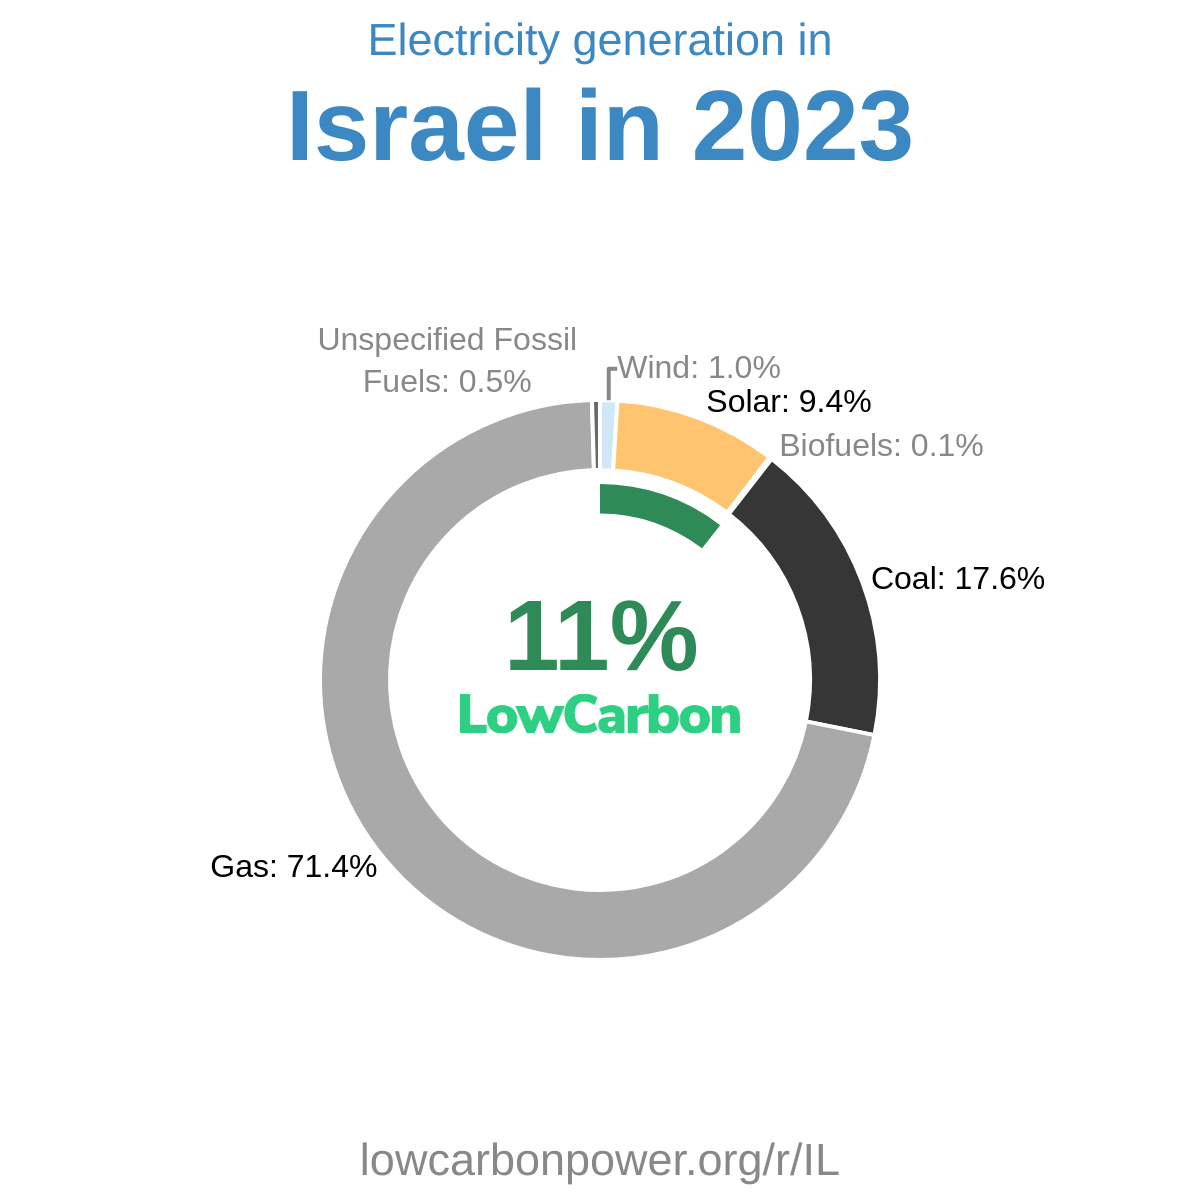
Jordan should build on its substantial solar contribution by expanding solar generation, alongside additional wind power and consideration of nuclear electricity. Nearby Lebanon, where solar supplies about 31% of electricity, and the sunny US state of Nevada, at roughly 33%, offer useful solar benchmarks. Morocco’s wind share of about 20% also provides a relevant regional example. For nuclear, Jordan can learn from the United Arab Emirates, where it supplies around 20% of electricity, and from France, where it provides roughly two-thirds. Combining expanded solar and wind with a nuclear programme could support a larger, more diverse low-carbon electricity supply.
History
Jordan’s low-carbon electricity history shows little change in hydro generation in the listed years between 1990 and 2004, followed by strong solar and wind growth from the mid-2010s. Wind generation increased by 0.1 TWh in 2015, and solar and wind together added 0.7 TWh in 2016. Their combined annual additions then rose from 0.6 TWh in 2017 to 0.8 TWh in both 2018 and 2019, reaching 1 TWh in 2020 and again in 2021. Solar led much of this expansion, including a particularly strong 0.8 TWh increase in 2021. Growth continued in 2022 but slowed noticeably, with solar adding 0.2 TWh and wind 0.1 TWh—a welcome gain, but a disappointing loss of momentum that reinforces the case for faster clean electricity expansion.
Electricity Imports and Exports
Balance of Trade
Nearby Regions