Electricity in St. Vincent & Grenadines in 2023
In 2023, St. Vincent & Grenadines relied on fossil fuels for almost 87% of its electricity consumption—more than six times the low-carbon share. Clean electricity accounted for just over 13%, entirely from hydropower in the supplied data. Expanding low-carbon electricity would help reduce this heavy fossil-fuel dependence and the associated climate impacts and air pollution.
Is Electricity Growing in St. Vincent & Grenadines?
The latest figures do not show electricity consumption reaching new heights. In 2023, consumption stood at about 1,480 kWh per person, around 24 kWh, or 2%, below the record set in 2016. Low-carbon electricity generation was about 197 kWh per person, roughly 79 kWh, or 29%, below its 2012 peak of 276 kWh. These comparisons do not establish the year-to-year trend, but they reveal a disappointing shortfall from earlier records, particularly for clean electricity. Renewed growth would help meet future demand from electrification and digital services, including AI.
Suggestions
St. Vincent & Grenadines should prioritize solar expansion while exploring suitable wind projects and considering nuclear electricity as part of its long-term clean-electricity planning. Island regions offer especially relevant examples: Samoa and Vanuatu each generate about 13% of their electricity from solar, while Cape Verde generates about 14% from solar and another 14% from wind. Cyprus and the US state of Hawaii each achieve about 23% solar electricity, offering further examples to study for rooftop installations, larger solar projects, storage and grid integration. For nuclear electricity, France and Slovakia generate roughly two-thirds of their electricity from this low-carbon source. Their experience can inform long-term assessments of nuclear options appropriate to the country’s scale, including emerging smaller-reactor designs and potential regional cooperation.
History
The historical series shows no reported annual change in hydropower generation from 2001 through 2020: every entry is recorded as zero TWh. Across both the 2000s and the 2010s, and again in 2020, the supplied figures therefore show no measurable expansion at their stated precision. These are changes in generation, not generation totals, so they do not mean hydropower produced no electricity; small movements may also be hidden by rounding. Nevertheless, the absence of recorded growth highlights the importance of adding new clean-electricity capacity rather than relying solely on the existing hydropower contribution.
Electricity Imports and Exports
Balance of Trade
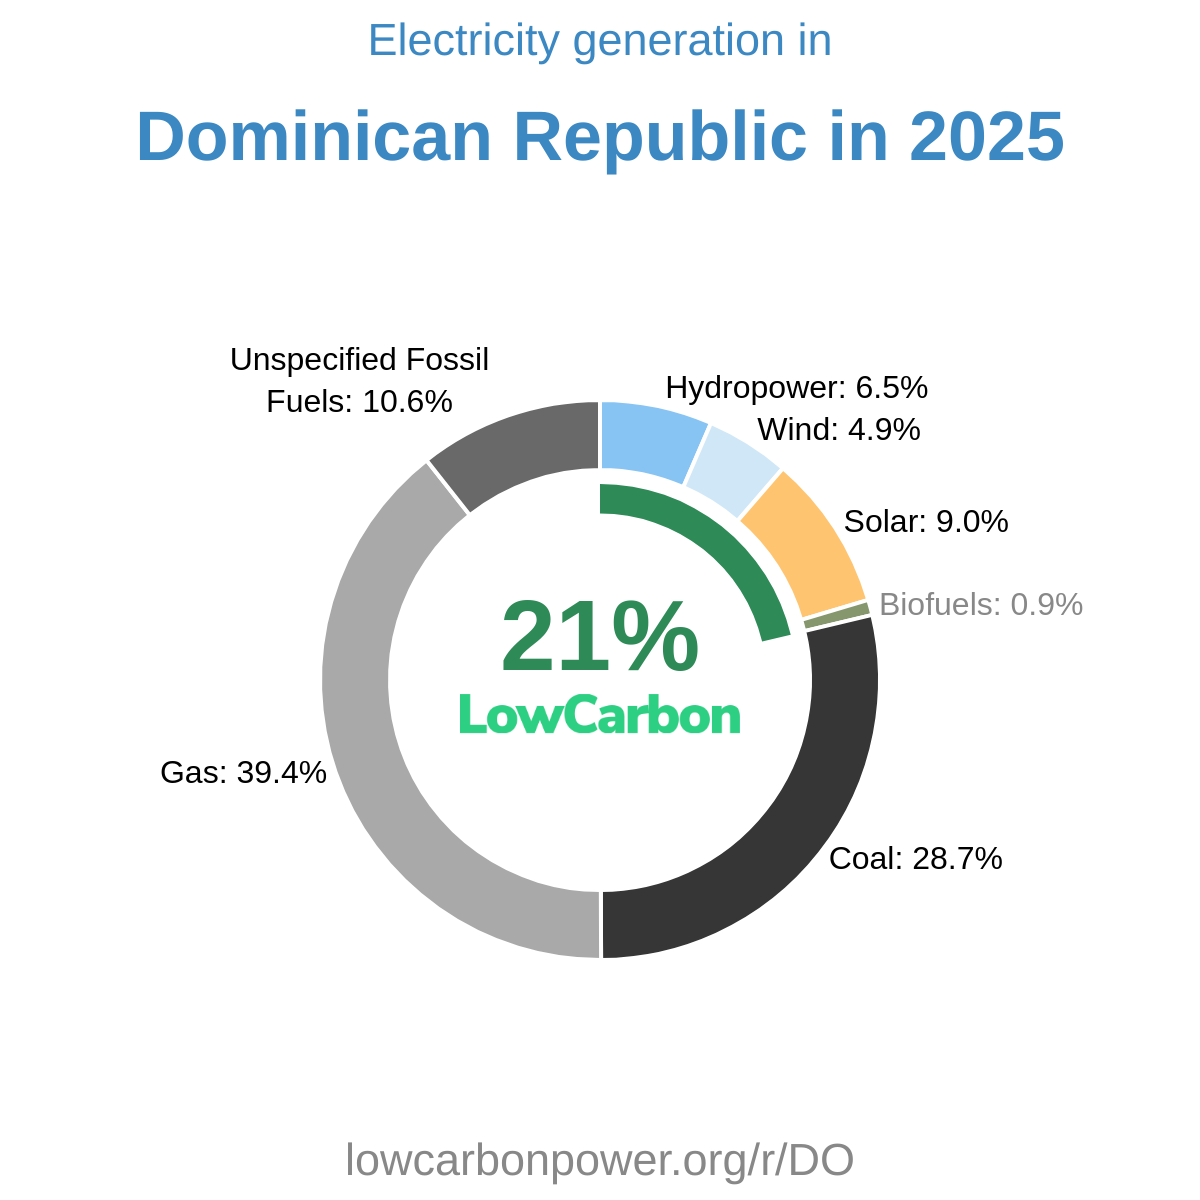
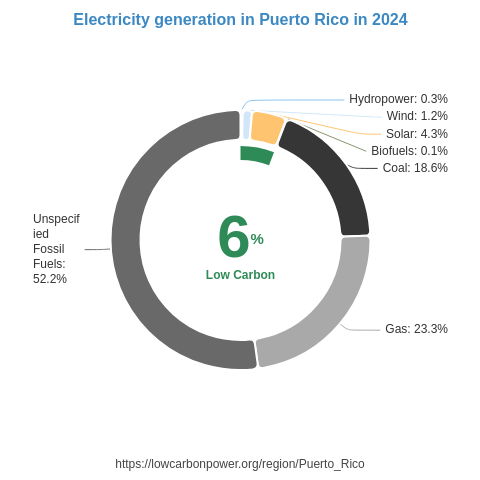
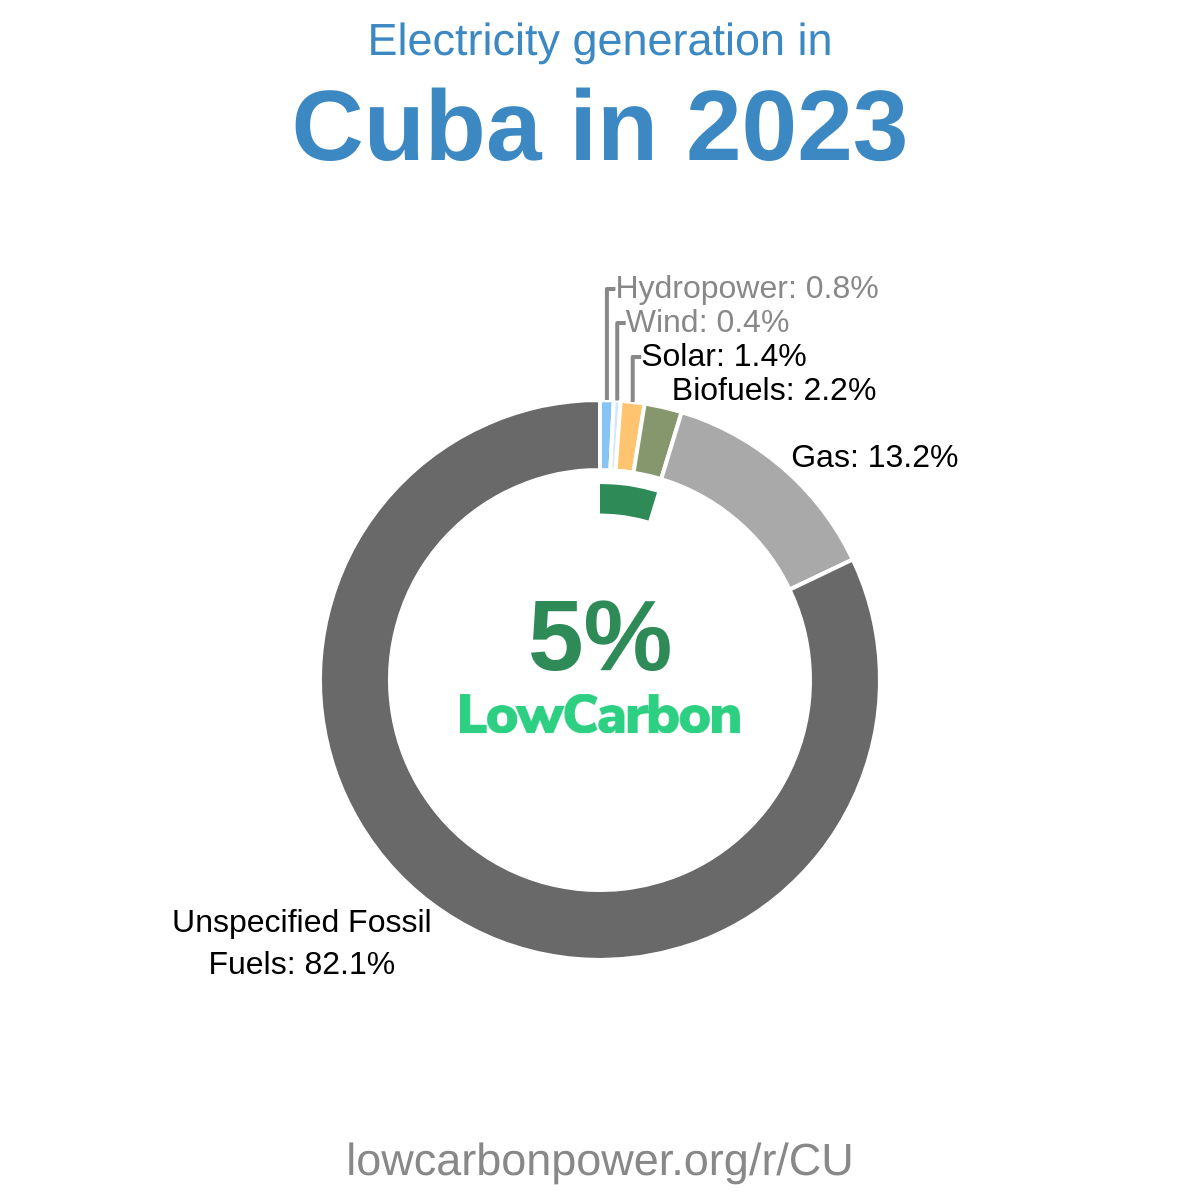
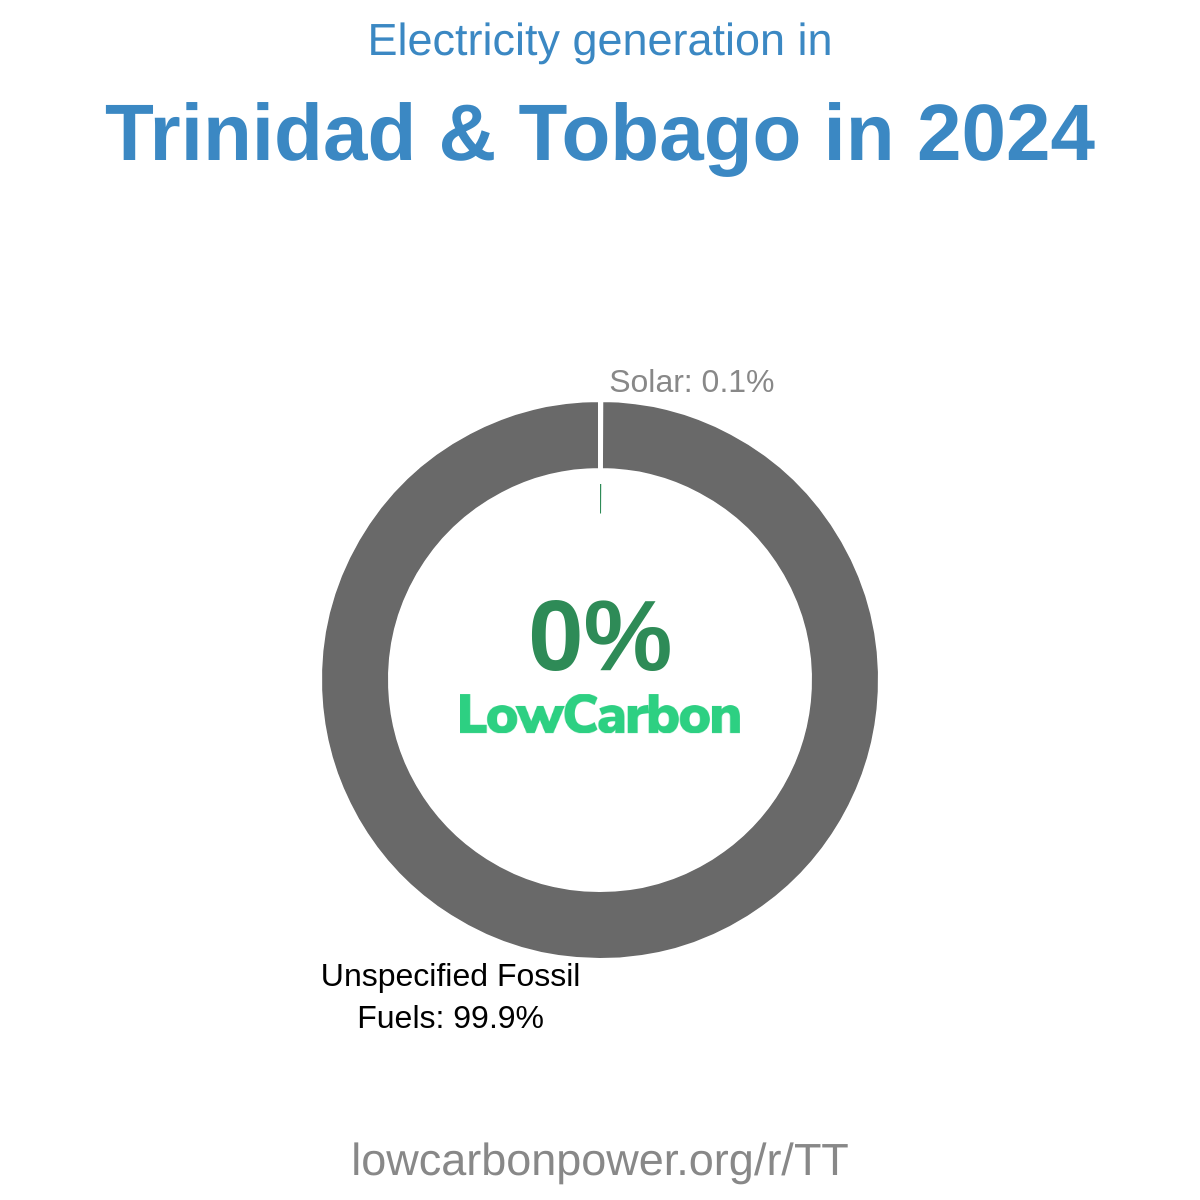
Nearby Regions