Electricity in Washington, D.C. in 2025/2026
From July 2025 through June 2026, Washington, D.C. relied on net electricity imports for about 95% of its consumption. Local low-carbon generation supplied roughly 4.5%, with solar contributing about 4%, including around 3.5% from behind-the-meter systems such as rooftop panels. The remaining roughly 0.4% came from local fossil generation. Imports overwhelmingly dominate the supply, but their generation mix is not specified, so these figures do not establish the full low-carbon or fossil share of the electricity consumed in the District.
Is Electricity Growing in Washington, D.C.?
Electricity consumption per person was essentially flat, with a slight decline rather than growth. The latest 2026 figure was 16,275 kWh per person, down 65 kWh, or about 0.4%, from the 2025 record of 16,340 kWh. Local low-carbon electricity generation, however, reached a new high of 728 kWh per person, up 114 kWh—about 19%—from the previous record in 2025. That clean electricity growth is encouraging, although the small decline in consumption underscores the importance of preparing for future electricity demand from electrification and AI rather than assuming demand will remain flat.
Suggestions
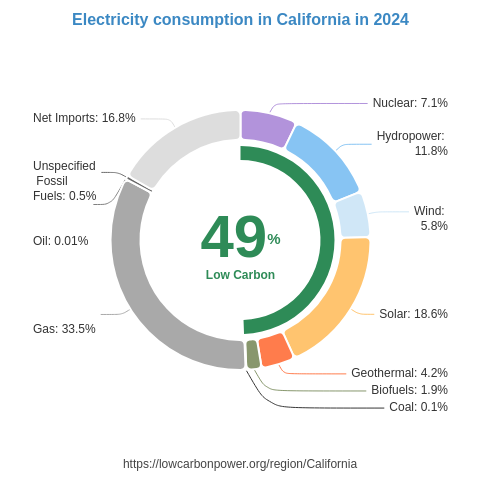
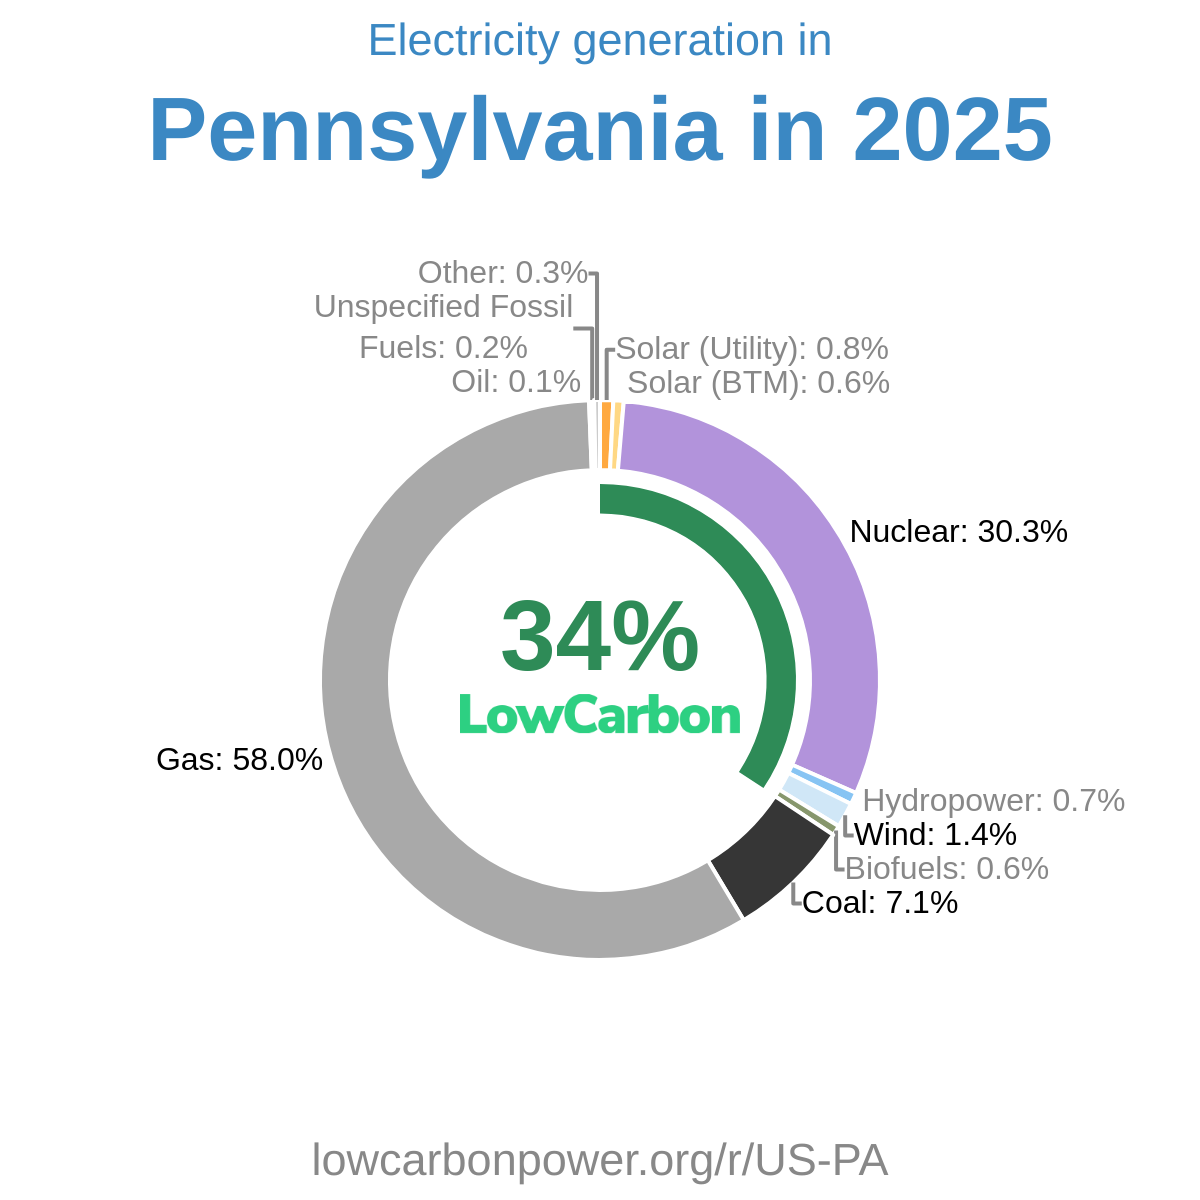
Washington, D.C. can increase local low-carbon generation by expanding rooftop and community solar on homes, public buildings, commercial properties, and parking canopies. Useful solar examples include the US states of Nevada and California, where solar supplies about 35% and 31% of electricity generation, respectively. For nuclear electricity, nearby examples are especially relevant: nuclear provides about 22% of generation in the US state of Maryland, 17% in the US state of Virginia, and 31% in the US state of Pennsylvania. The District can support regional nuclear expansion and secure long-term nuclear electricity contracts alongside its local solar growth. Regional wind procurement would further diversify clean supply, drawing lessons from places such as Denmark and the US state of Iowa, where wind provides well over half of electricity generation. Procurement can make imports cleaner, while projects within the District directly increase local generation.
* 12M = Last 12 months (Jul 2025 – Jun 2026) — a rolling 12-month period, not a calendar year.
History
The supplied historical record covers only biofuels from 2024 through 2026, rather than the District’s full low-carbon electricity history. In each of those three years, biofuel electricity generation showed no change from the previous year. This indicates a stable contribution over the period, not necessarily zero generation. The record provides no historical changes for solar or nuclear, so it cannot establish their longer-term trajectories; the latest figures nevertheless show a welcome new record for total local low-carbon generation per person.
* 12M = Last 12 months (Jul 2025 – Jun 2026) — a rolling 12-month period, not a calendar year.
Electricity Imports and Exports
Balance of Trade
* 12M = Last 12 months (Jul 2025 – Jun 2026) — a rolling 12-month period, not a calendar year.
Nearby Regions


.png)