In the period spanning from April 2025 to March 2026, electricity consumption in the People's Republic of China showcases a significant dependency on fossil fuels, although a substantial portion is derived from low-carbon sources. More than half of the country's electricity comes from fossil fuels, with coal alone accounting for an overwhelming majority of this share, contributing to environmental challenges like air pollution and climate change. On the brighter side, China is generating a considerable amount of low-carbon electricity, contributing almost 43% to the total mix. Hydropower remains a leading clean energy source, providing just under 14%, while solar, integrating both behind-the-meter and utility-scale, contributes almost 12%. Wind matches similarly with just over 10% of the electricity mix, and nuclear, a crucial low-carbon contender, adds nearly 4.5%. Despite the potential of natural gas and biofuels, their shares hover at around 2% each, indicating an opportunity for further expansion in the low-carbon sector.
Is Electricity Growing in People's Republic of China?
The recent increase in electricity consumption per capita, from 7401 kWh in 2025 to 7483 kWh in 2026, signals a positive trend of growth, albeit modest. This increase of 83 kWh per person highlights the expanding demand and capacity for electricity in China. Concurrently, clean energy generation per person has seen a rise from 3137 kWh in 2025 to 3182 kWh in 2026. Even though the increase of 45 kWh per person in low-carbon sources is commendable, it emphasizes the need for more aggressive escalation in clean energy production. This incremental growth, while encouraging, indicates there is plenty of room for accelerating the transition towards a cleaner electricity network to meet China's growing demands and support future developments like electrification and the burgeoning impact of AI.
Suggestions
To enhance its low-carbon electricity generation, China should prioritize scaling up its wind and solar operations. Expanding these sources, which already produce substantial electricity, could significantly minimize dependency on fossil fuels. Observing successful case studies worldwide can offer valuable insights. For instance, Denmark's example of generating 60% of electricity from wind could be a blueprint for China's wind sector expansion. Similarly, embracing nuclear energy, as evidenced by France's impressive 67% nuclear generation, offers a robust path towards a more sustainable electricity mix. States like Nevada, with their substantial focus on solar (34%), further demonstrate the potential of solar energy. By integrating strategies from these regions, China can effectively bolster its low-carbon electricity output and lead in global clean energy efforts.
* 12M = Last 12 months (Apr 2025 – Mar 2026) — a rolling 12-month period, not a calendar year.
History
Historically, the People's Republic of China has undergone considerable shifts in low-carbon electricity generation. In the early 2000s, hydropower saw vast developments, peaking with a notable increase of 173 TWh in 2012. The 2010s pursued this momentum, though the pace of hydropower growth slowed with some declines after 2016. However, wind and solar have made significant inroads more recently. The 2020s have marked robust growth, particularly in wind generation, with monumental increases including nearly 188 TWh in 2021 alone. Similarly, solar energy started gaining traction that year, doubling the following year in 2022 and witnessing further substantial hikes in 2023. This growing focus on wind and solar during the 2020s indicates a promising trajectory for China’s low-carbon energy future, underscoring the nation's commitment to clean and sustainable electricity generation.
* 12M = Last 12 months (Apr 2025 – Mar 2026) — a rolling 12-month period, not a calendar year.
Electricity Imports and Exports
Balance of Trade
* 12M = Last 12 months (Apr 2025 – Mar 2026) — a rolling 12-month period, not a calendar year.
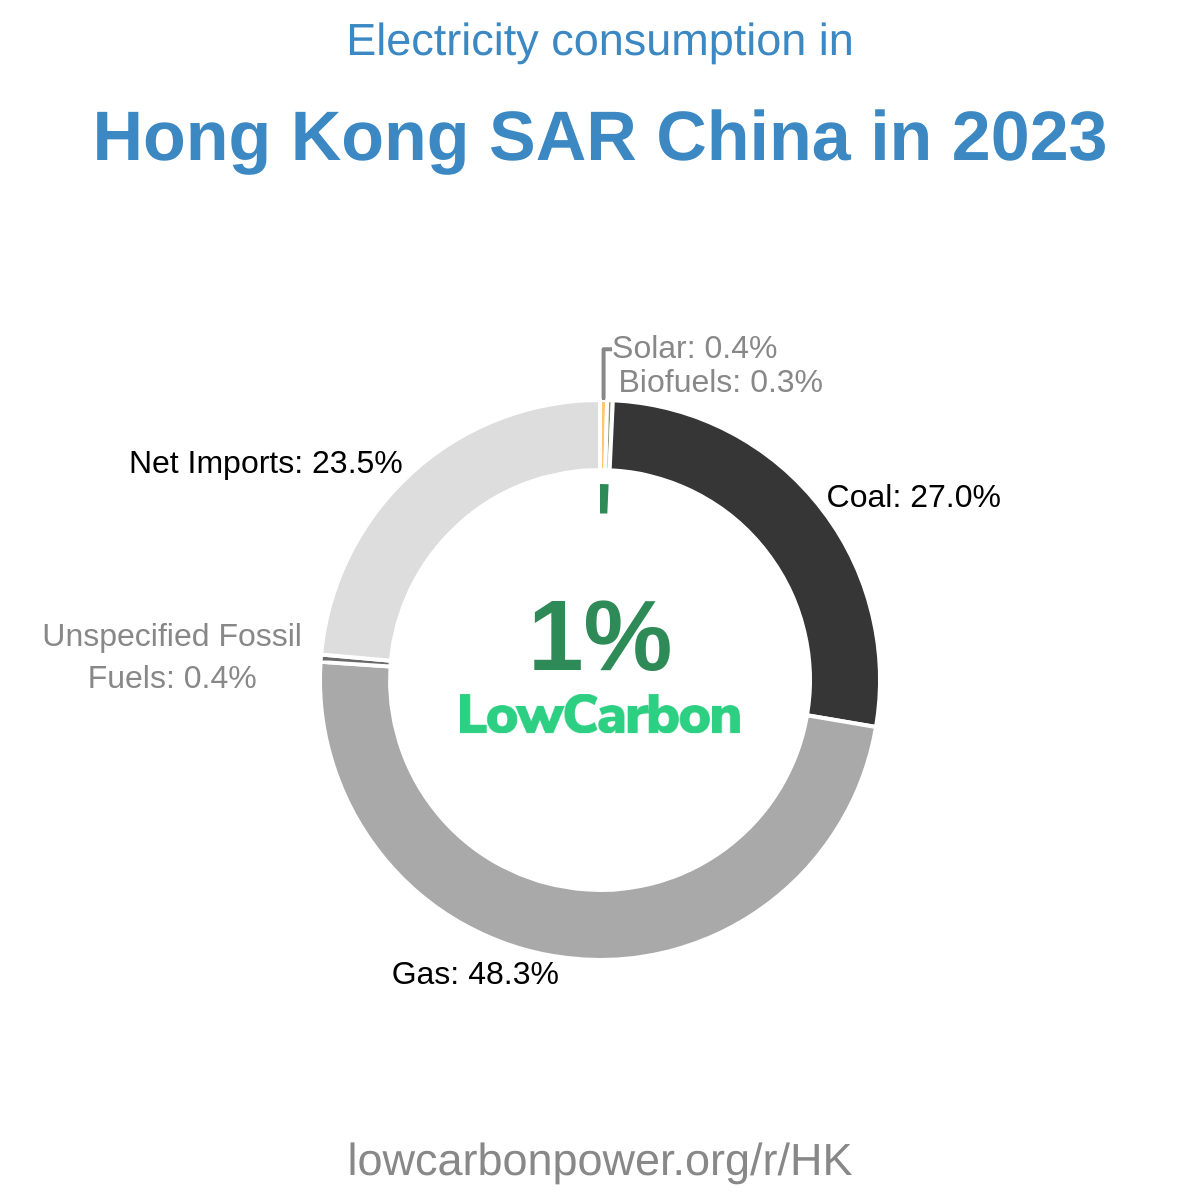
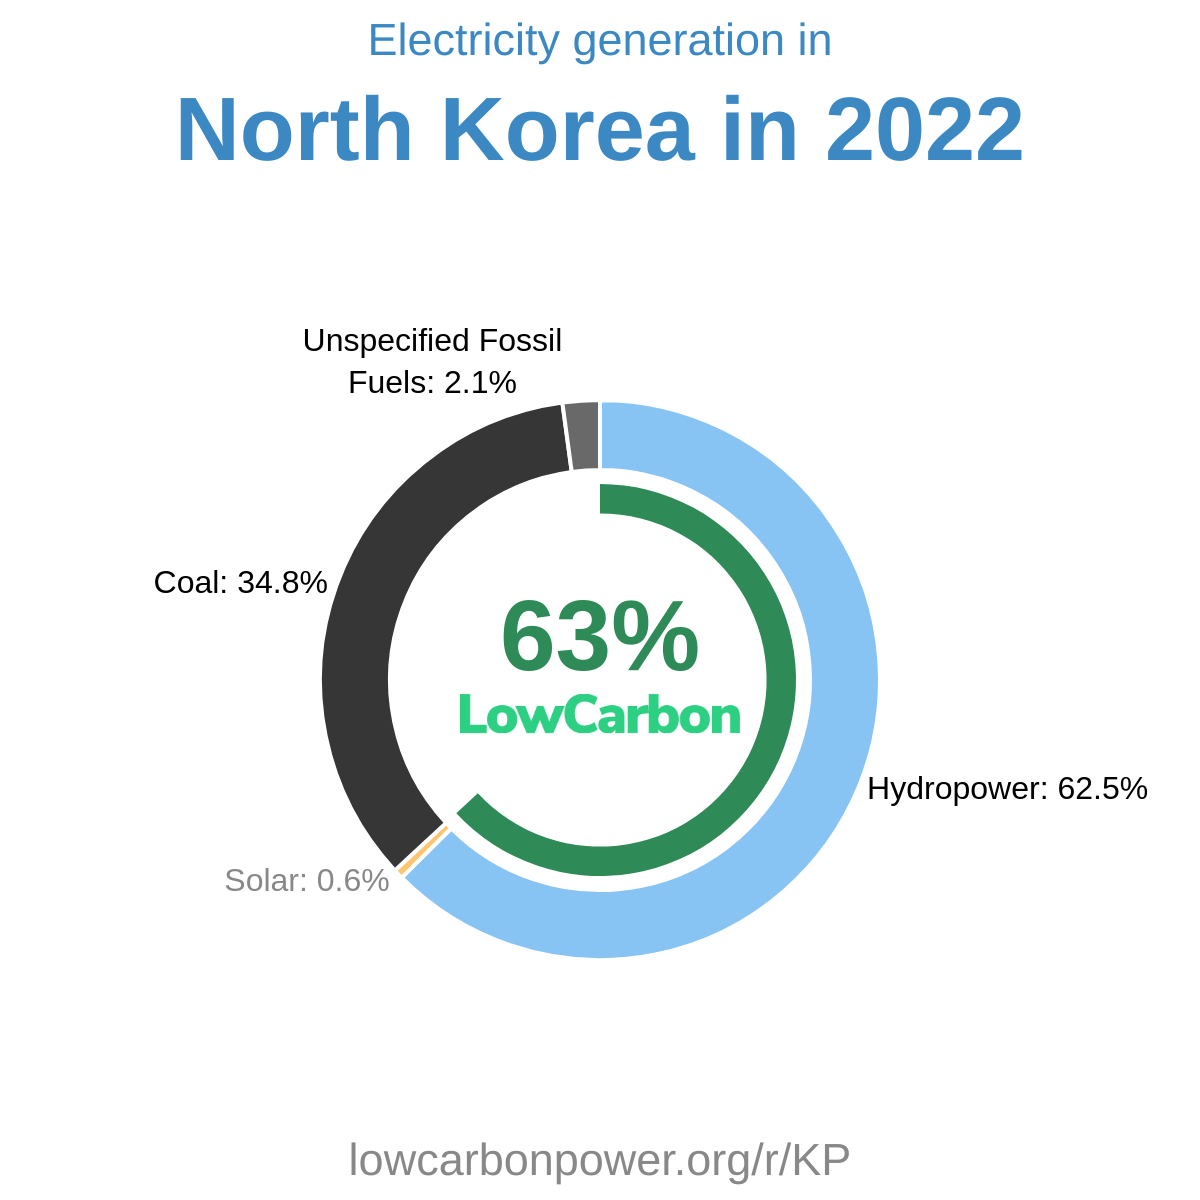
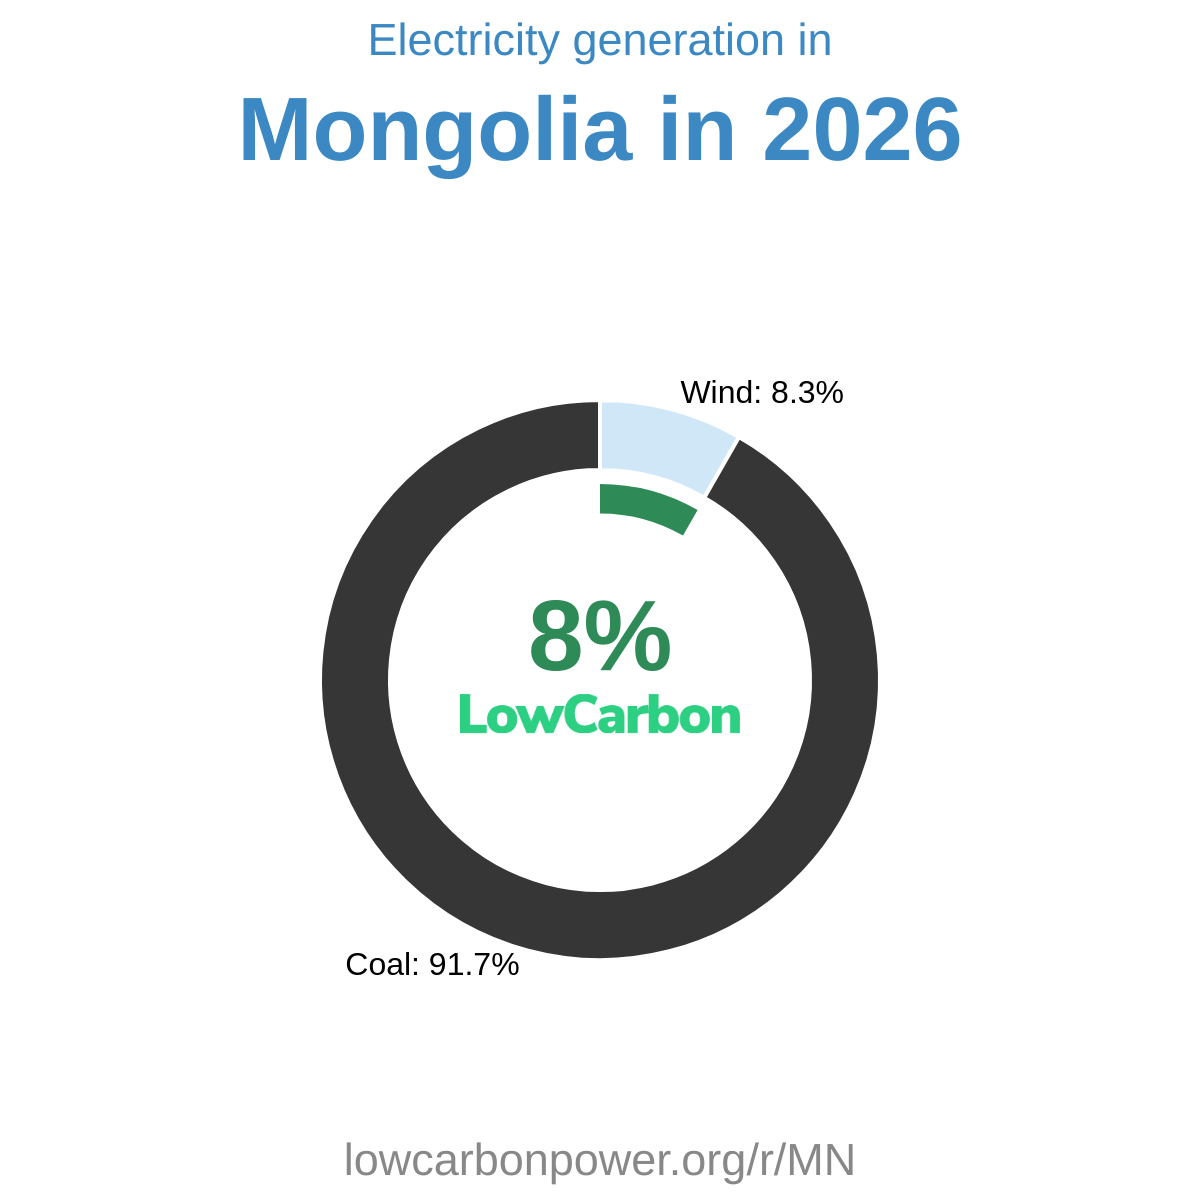
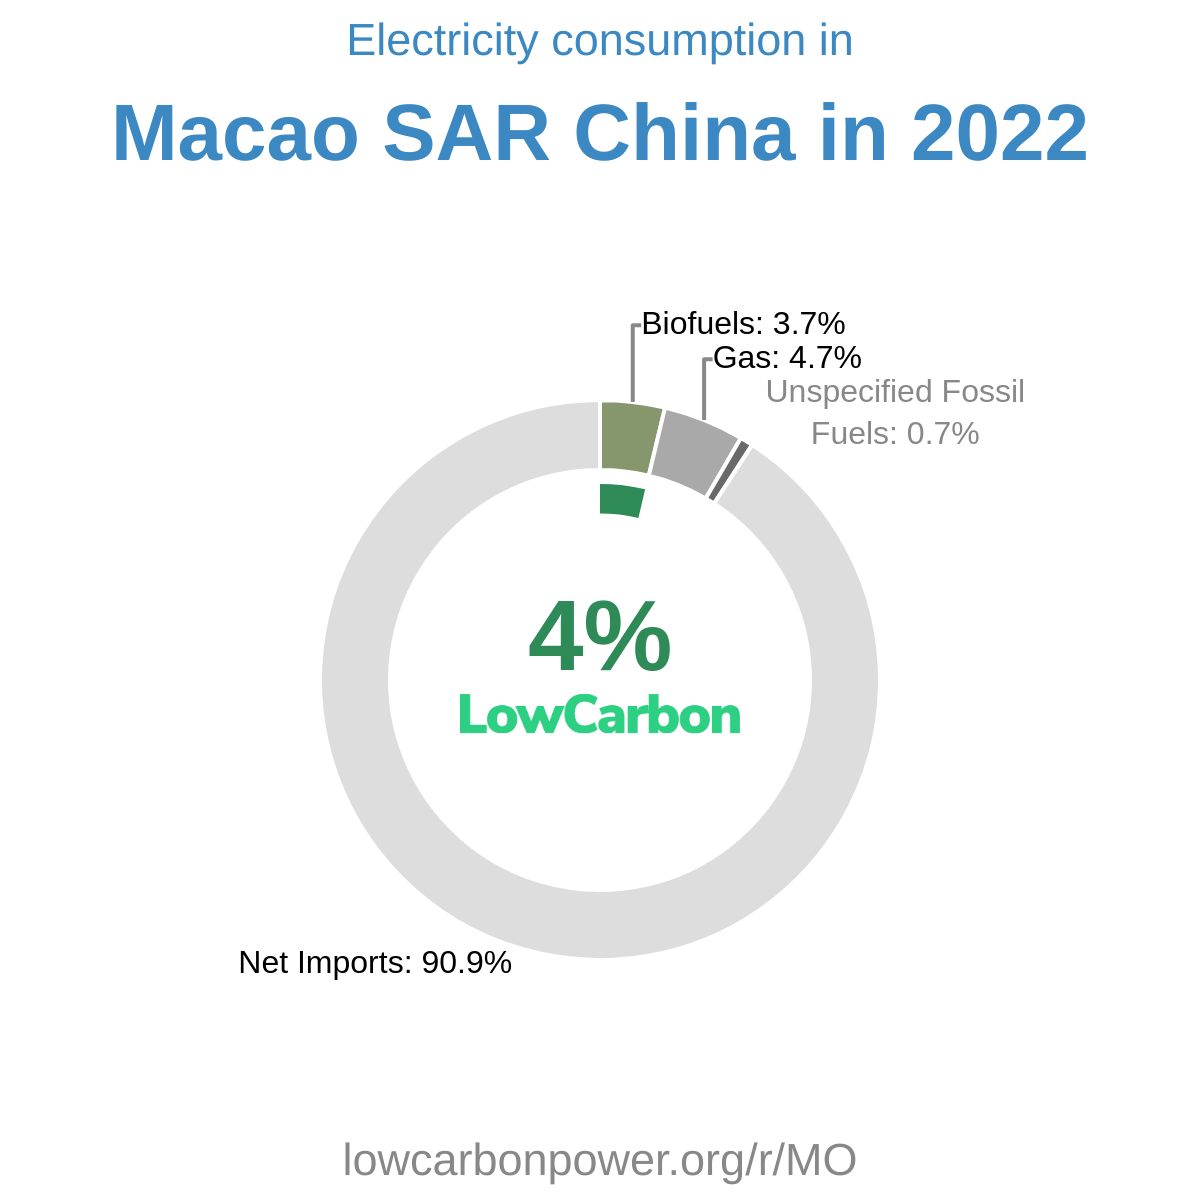
Nearby Regions

.png)