

In 2018, Curaçao relied on fossil fuels for about 71% of its electricity, all of it from oil. Low-carbon sources supplied almost 29%, with wind providing 27% and solar about 2%. Wind was therefore the backbone of clean electricity generation, although oil still supplied more than twice as much electricity as all low-carbon sources combined.
Is Electricity Growing in Curaçao?
Electricity consumption per person in Curaçao was well below its historical peak in 2018, rather than setting a new growth record. Consumption reached about 4,770 kWh per person, down roughly 3,670 kWh, or 43%, from the 2010 record of around 8,440 kWh. This substantial shortfall is concerning as electrification and emerging uses increase the need for electricity. Low-carbon electricity, however, showed encouraging growth: generation reached about 1,390 kWh per person, exceeding the previous record set in 2017 by about 280 kWh, or 25%.
Suggestions
Curaçao can build on its established wind sector while substantially expanding solar electricity. Denmark, where wind supplies 58% of electricity, offers useful experience in integrating a large wind contribution. For solar, relevant island examples include Cyprus and the US state of Hawaii, where solar supplies about 24% and 23% of electricity, respectively; Cape Verde also provides an island example at 14%. These places demonstrate opportunities to increase solar far beyond Curaçao’s 2% share. Curaçao should also consider nuclear electricity as part of its long-term clean electricity planning, drawing lessons from France, where nuclear supplies about two-thirds of electricity, and the United Arab Emirates, where it supplies one-fifth. Expanding clean electricity can reduce reliance on oil and its associated climate emissions and air pollution.
History
The supplied historical figures show little reported change in wind generation during the 1990s, followed by an increase of about 0.1 TWh in 2001. Another wind increase of around 0.1 TWh occurred in 2013. From 2014 through 2016, both wind and solar recorded no change at the precision shown, and wind also showed no reported change in 2017. That period of limited progress gave way to a welcome wind increase of about 0.1 TWh in 2018. Overall, the recorded advances came in distinct wind-led steps, while the listed solar figures show no measurable annual increases at the reported precision.
Electricity Imports and Exports
Balance of Trade
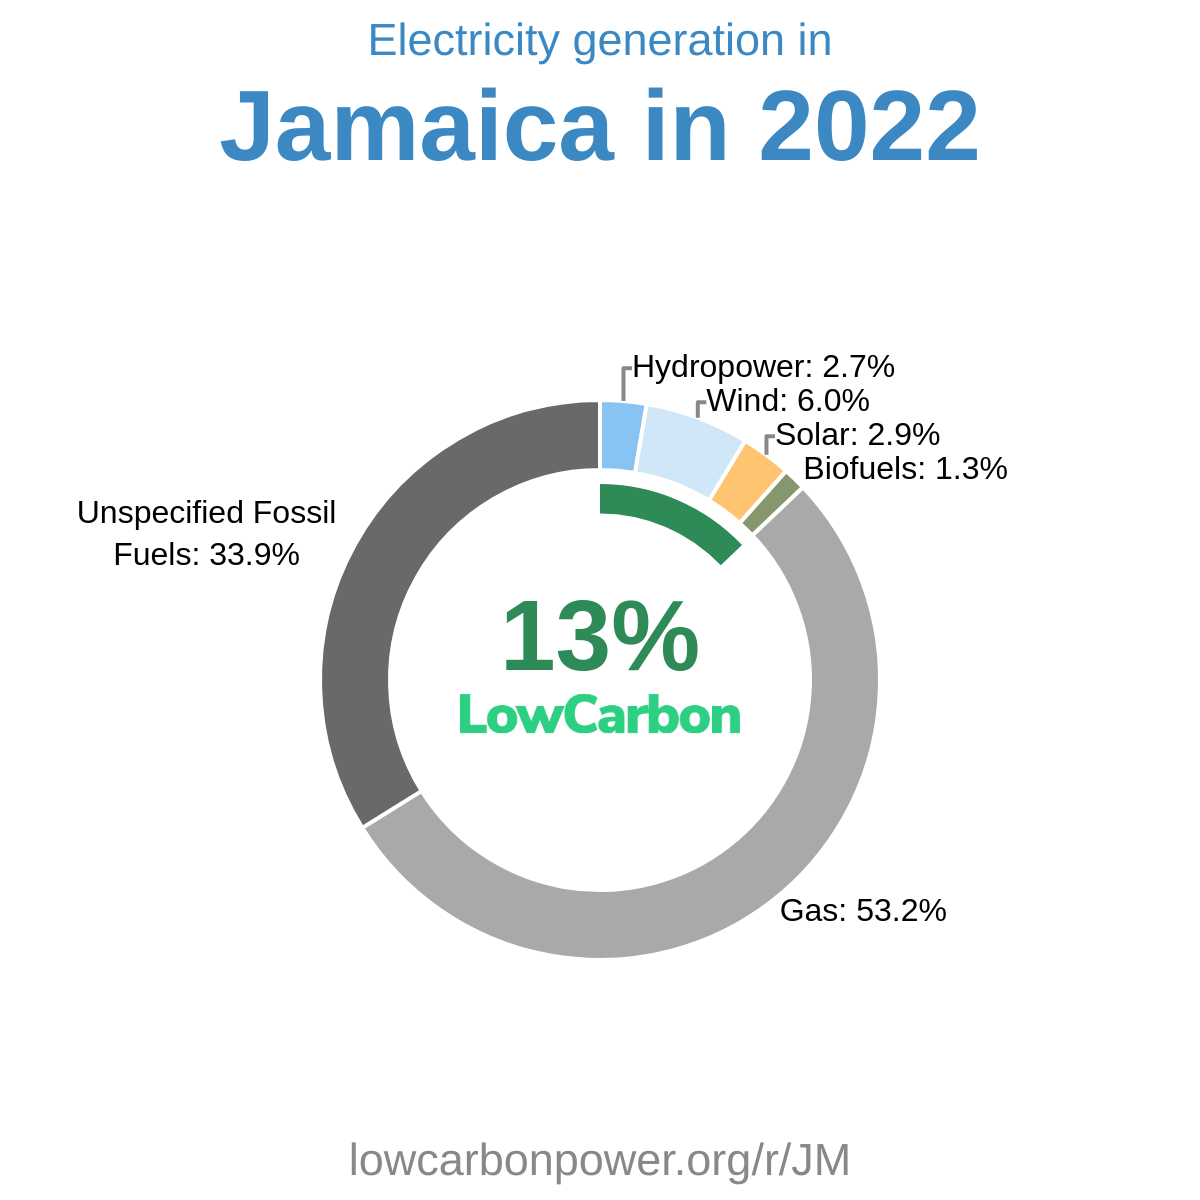
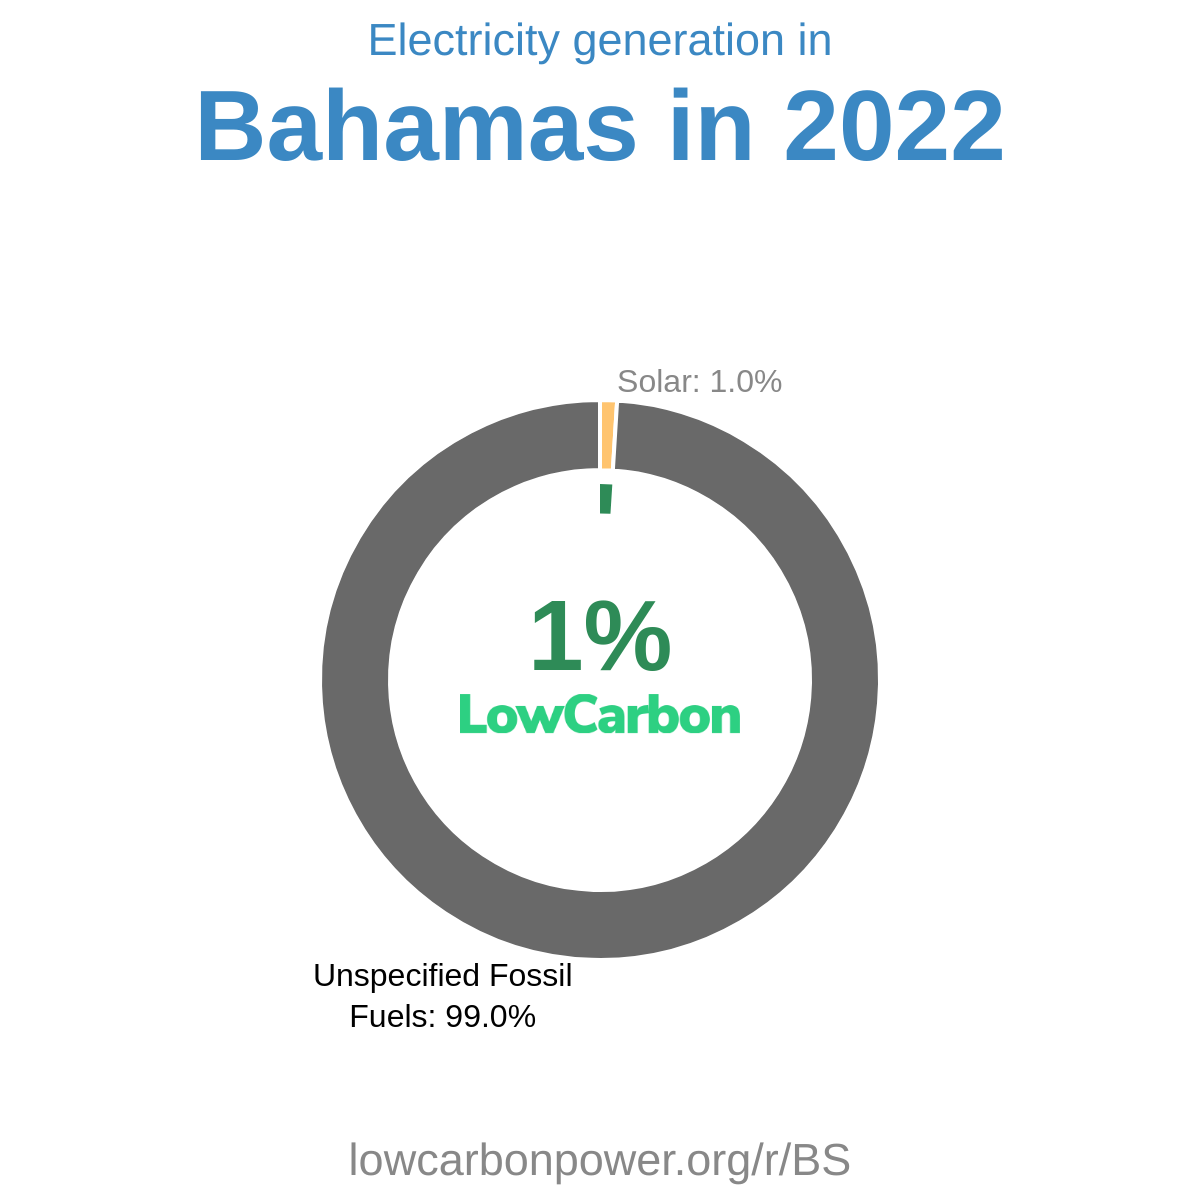
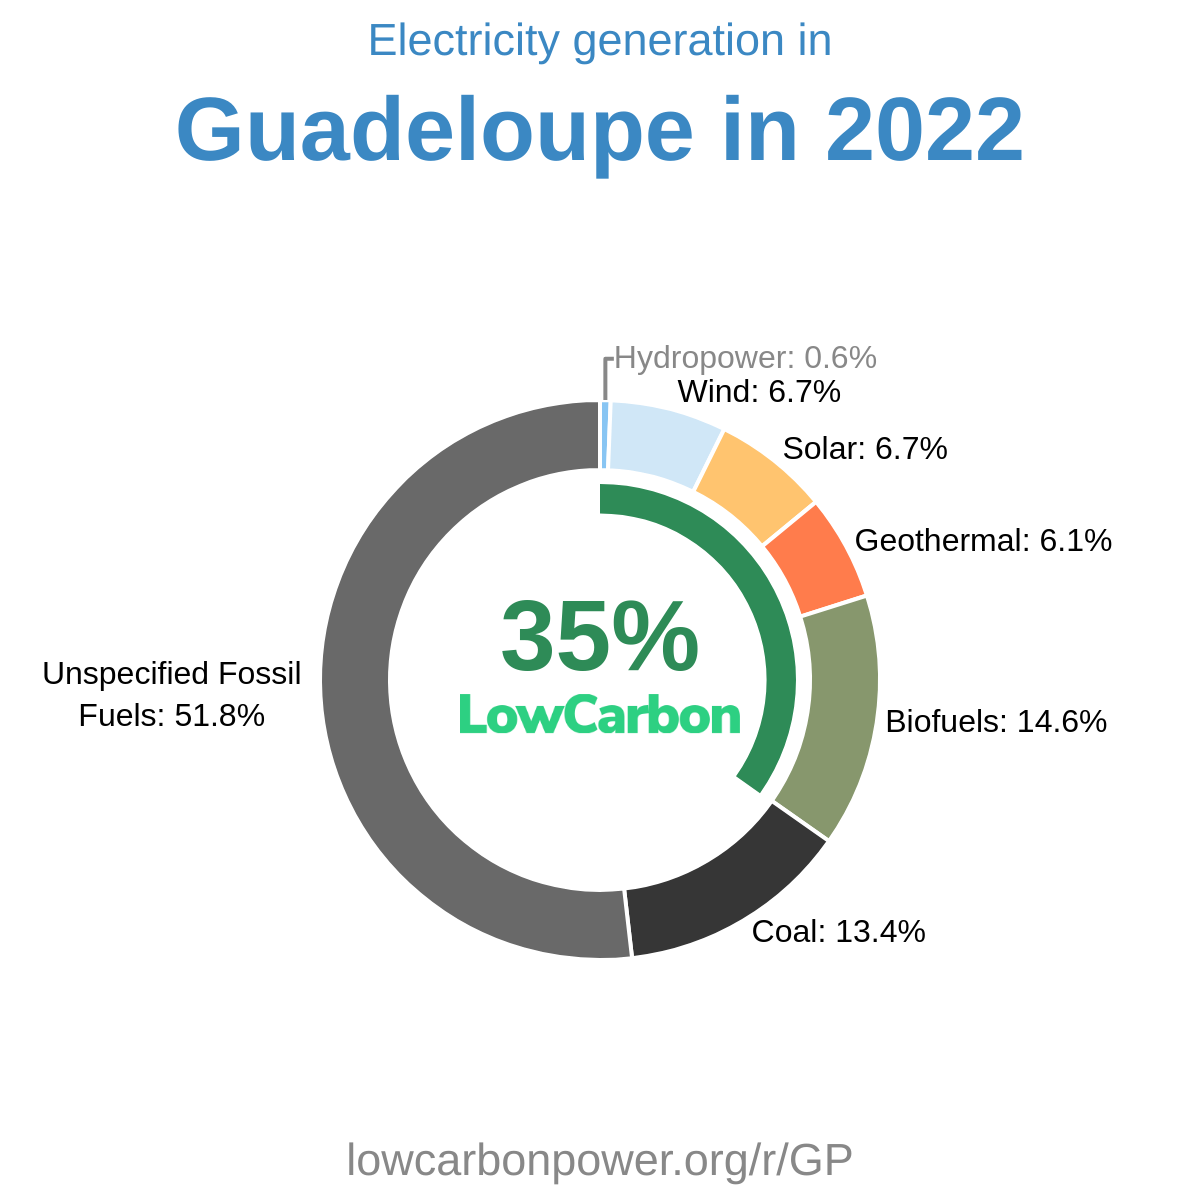
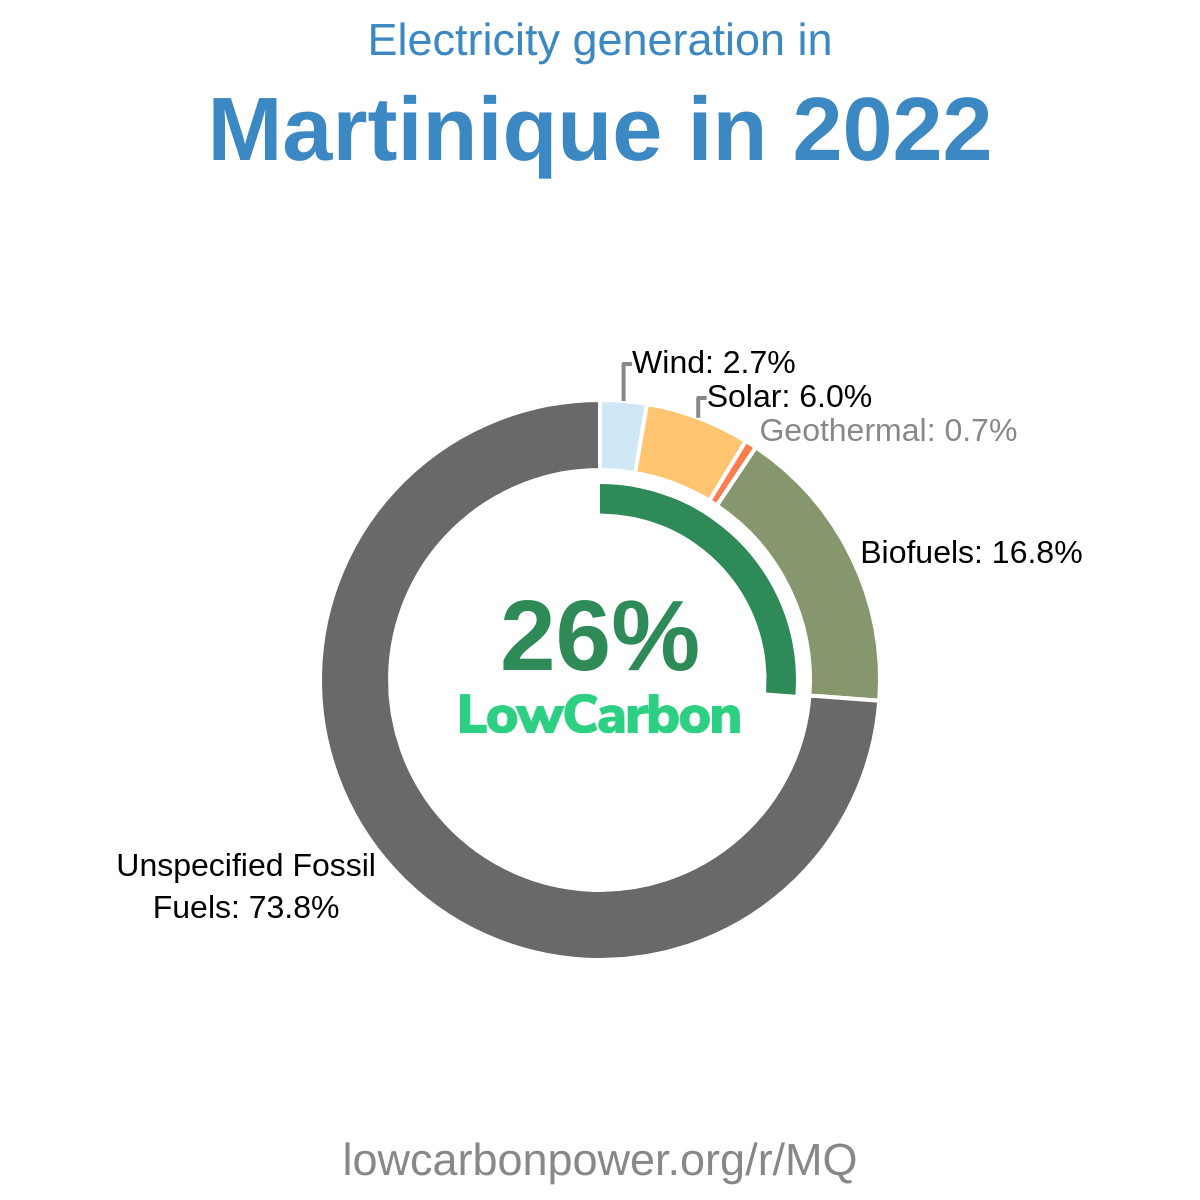
Nearby Regions