2025年10月化石能源增长超过低碳能源,主要由于中国大陆的推动
2025年10月,报告地区的总电力增长了约+1104亿度电,占全球电力的58%。其中低碳电力增加了约+521亿度电,而化石能源电力则增加了约+625亿度电——这意味着在最近一个月中,化石能源的增长超过了低碳能源的增长。
电力增长最快的国家
中国大陆在10月份增加了约+1023亿度电,占所有报告地区净增加+1104亿度电的约93%。美国是第二大贡献者,增加了约+72亿度电。在其他有10月份数据的国家中,法国(+11亿度电)、波兰(+7.4亿度电)和德国(+6.7亿度电)是增长最多的国家。最大的下降来自瑞典(约−9.4亿度电)、意大利(约−8.8亿度电)和奥地利(约−6.8亿度电)。
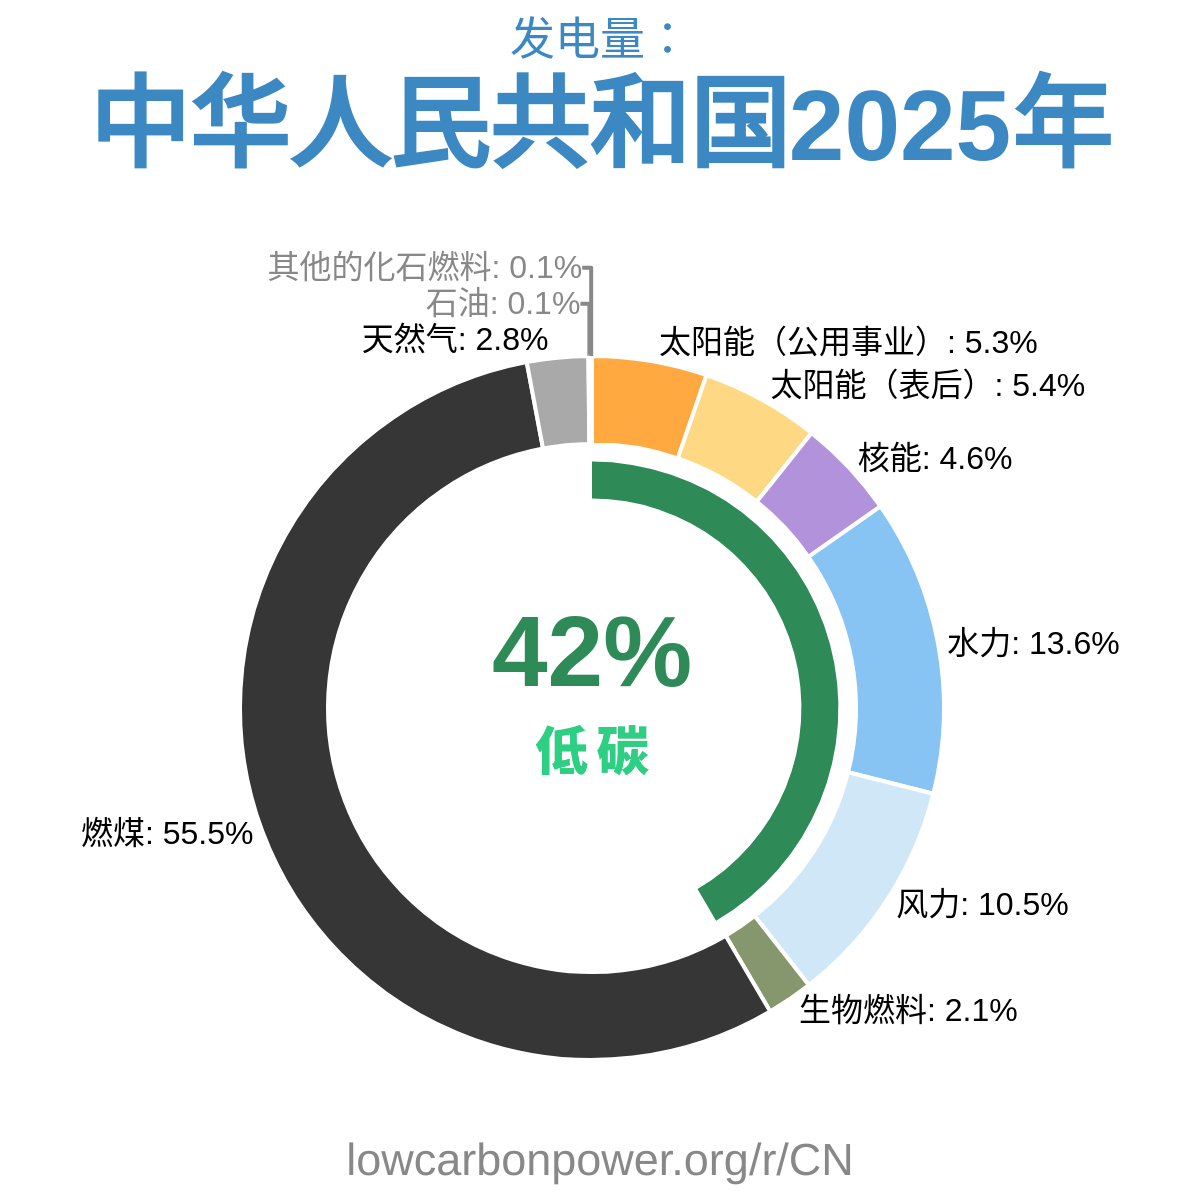
在中国大陆,10月份的电力激增分为低碳电力(+481亿度电)和化石能源电力(+543亿度电)。太阳能是低碳增长的主要来源(+438亿度电),水电强劲反弹(+313亿度电),而核电增加了约+20亿度电;不过,风电产量则减少了约−117亿度电。
全球趋势(以及58%覆盖率的意义)
这些变化将2025年10月与2024年10月进行了比较。由于报告地区覆盖了全球58%的电力,这一变化的方向和整体趋势提供了有用的信息——尤其是因为它包括了中国大陆和美国这样的庞大系统——但随着其他数据的到来,全球总数可能仍会发生变化。在10月的报告数据中,化石发电的增长速度超过了低碳供应,表明在覆盖地区内的本月增量需求中,化石能源占据了较大份额。
10月哪些能源来源变动最大
在所有有10月数据的地区,低碳增长主要受太阳能(+503亿度电)和水电(+206亿度电)的驱动。核电增加了约+24亿度电。尽管一些国家实现了增长,但由于中国大陆的下降幅度较大,风力总量略有减少(约−41亿度电)。
年度迄今的背景
截至目前为止2025年的每个月份,报告地区的总电力月均变化约为+925亿度电,低碳电力增加约+827亿度电,而化石能源电力增加约+85亿度电。